REVIEW
The market started this record breaking week at SPX 2130. The market opened higher Monday, gapped up Tuesday, had a small pullback Wednesday, gapped up again Thursday hitting SPX 2169. Then consolidated on Friday. For the week the SPX/DOW gained 1.75%, and the NDX/NAZ gained 1.45%. Economic reports for the week were mostly positive. On the downtick: import prices and consumer sentiment. On the uptick: business/wholesale inventories, export prices, the CPI/PPI, retail sales, the NY FED, private investment, industrial production and capacity utilization, plus there was another budget surplus. Next week will be highlighted by: the ECB meeting, Leading indicators, the Philly FED and Housing reports. Best to your weekend and week!
LONG TERM: uptrend
At the beginning of 2010 OEW confirmed the, once every four generation, Super Cycle bear market ended in March 2009. And, a new 70-80 year Super Cycle bull market was underway. Since Super Cycle bull markets unfold in five Cycle waves, we were labeling the first bull market as Cycle wave [1]. When the bull market moved into 2012 we anticipated it would last five years. Then when it cleared the five year point in 2014 our expectations stretched to eight years.
By late 2014 into early 2015 the SPX became quite choppy, and actually formed a diagonal triangle by May 2015 at 2135. At first we did not recognize that as the bull market high and were looking for at least one more wave to end it. That wave occurred by November 2015 when the SPX topped just 1% below the actual high. When the market started to decline it looked like the dreaded Cycle wave [2] bear market was underway. Dreaded because during Cycle wave bears the market loses 45%-50% of its value.
By January 2016 the bear market was confirmed, and by February the bear market made a lower low. Then something occurred that has not occurred since the year 1953. Right after the last index confirmed the bear market, the stock market started to rally. At first we thought this was just a bear market rally and targeted SPX 1950-2000. When the SPX exceeded 2000 in late March we knew something was just not right. The rally ended in April just above SPX 2100, then entered a choppy two month correction period. When the market did not start heading down substantially in May we switched from bearish to neutral. Where we remained until this week.
While in neutral we contemplated the possibilities, and recognized that a couple of the indices appeared to have only completed four waves of their bull market. This suggested the SPX may need to make new highs while they completed their fifth wave. During this period we uncovered several potential counts that could explain what was transpiring. In the end we settled on the two we have been presenting for several weeks. The NYSE Primary V count, which many have embraced, and the SPX irregular B wave count.
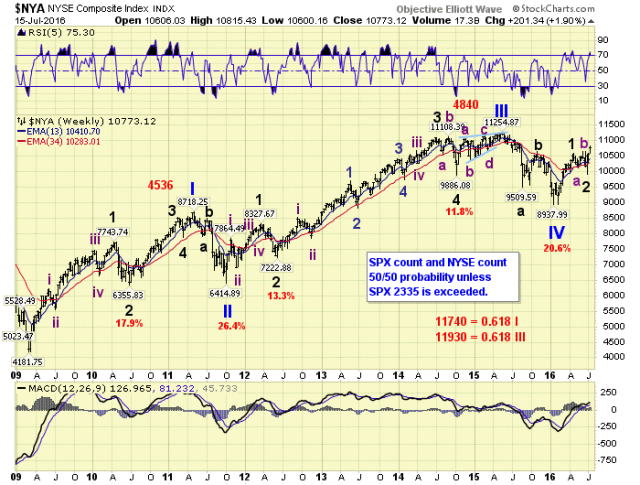
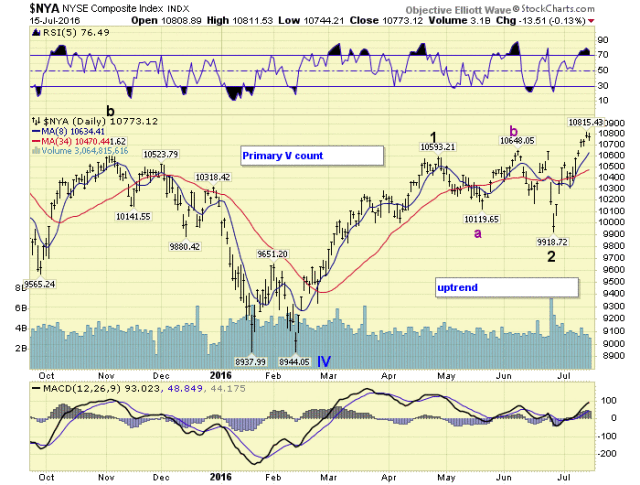
The NYSE is fairly straight forward. This index did four quantified waves into the 2016 low, and is now in Primary V. The same can be said for the Transports.
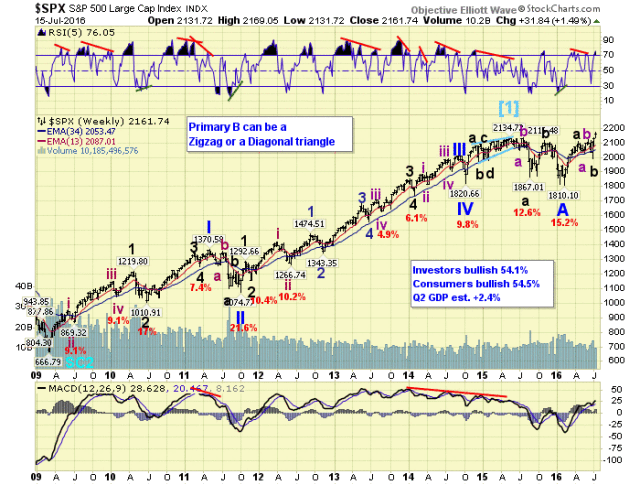
The SPX is quite different. This index did five waves from 2009-2015, and then declined into 2016. The same can be said for the DOW, NDX, NAZ and Wilshire 5K. This is what we have been calling a bifurcated market.
MEDIUM TERM: uptrend
To simplify access to these two charts we have moved the NYSE charts to just below the SPX charts on page one. Page two now contains the NAZ, NDX charts and the others remain in the same order. The link for stock charts is below.
Thus far from the February Primary IV low the NYSE has risen in a Major wave 1, then did an irregular Major wave 2. Major wave 3 is currently underway. A couple of upside targets for Primary V are posted on the weekly chart in the previous section. Currently the NYSE is about 4% from all time new highs.
The SPX looks similar to the NYSE from its February Primary A low. It has risen in one wave which is labeled Major wave A, did an irregular correction for Major wave B, and is now uptrending in Major wave C. However it has already made all time new highs, and 4% from current levels would put the SPX at about 2250.
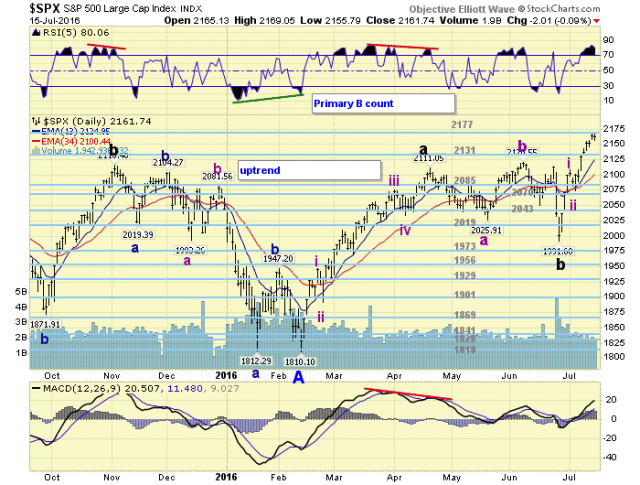
Theoretically the maximum upside potential for an irregular B wave is a Fibonacci relationship of 1.618 times the A wave. This projects a maximum upside potential of SPX 2335. Should the NYSE manage to complete five waves up from its Primary IV while the SPX remains under this level, then they can both decline in a bear market together ending bifurcation. Should the SPX exceed that level the outcome would be quite bullish long term. We will get into those details at another time. Medium term support is at the 2131 and 2085 pivots, with resistance at the 2177 and 2212 pivots.
SHORT TERM
As noted earlier the SPX completed an uptrend from the February 1810 low to the April 2111 high, then entered an irregular correction: 2026-2121-1992. The third wave was in response to the Brexit vote in the UK. Right after that decline the SPX took off to the upside and has already made new all time highs.
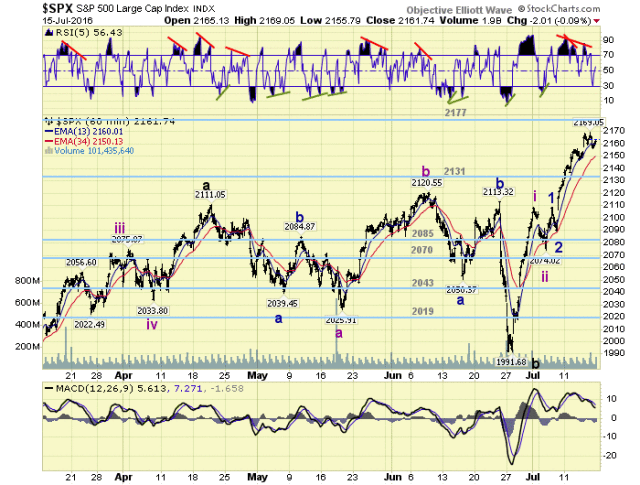
We are labeling this current uptrend, Major C, as an impulse wave, similar to the previous uptrend. Thus far we have Intermediate waves one and two completed, with a subdividing Int. wave three underway. In fact, the two uptrends do look quite similar. We are expecting Int. three to end right around the 2212 pivot, or higher. Then after about a 30 point pullback for Int. four, Int. five should take the SPX into the 2250-2280 range to end the uptrend. Then it will get interesting. We will deal with that as it unfolds. Short term support is at the 2131 and 2085 pivots, with resistance at the 2177 and 2212 pivots. Short term momentum ended the week oversold. Best to your trading!