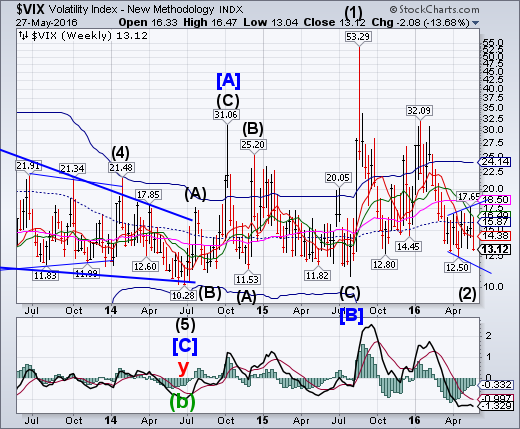
VIX may be forming what is known as a Broadening Bottom formation that is marked by successive higher highs and lower lows. If correct, this decline may be the last. These formations are hard to identify, since they are rare and are not identifiable until the fifth and final point, likely to be beneath 12.50. In the meantime, it has given several false buy and sell signals. The Cycles Model suggests a probable low on Tuesday. Broadening formations (tops and bottoms) are often known as reversal patterns.
(ZeroHedge) With Goldman suggesting VIX should be in the upper teens based on 'fundamentals' and event risks galore on the horizon (FOMC, Brexit, Spain elections, US elections, etc.) Geneva Swiss Bank suggests it is time to BTFVIX...
SPX rises to round number resistance.
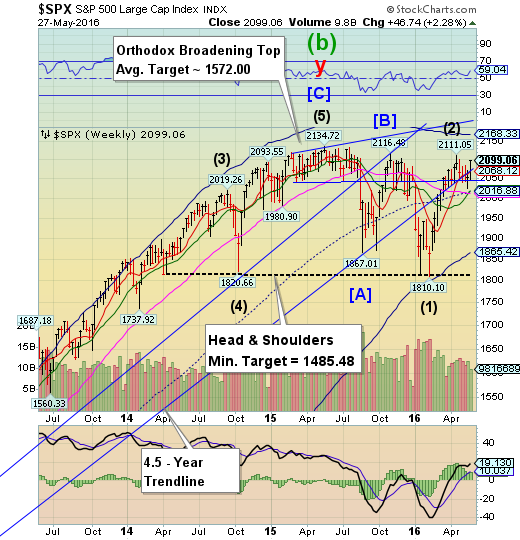
When SPX broke beneath its critical shelf of support at 2044.00, it gave a bear signal. However, a week later it is challenging round number resistance at 2100.00. Should it break above that resistance and make a new high above 2111.05, a bull signal may develop. However, a critical Pivot day may occur early next week, so caution is the byword.
(MarketWatch) By one measure, U.S. stocks are even more expensive than they were during the tech bubble of 2000.
While price-to-earnings ratios, which can be manipulated by financial engineering, aren't at alarming levels, price-to-sales ratios indicate stocks are well beyond being merely fully priced, as the chart from Ned Davis Research below shows.
The price-to-sales ratio divides a company’s stock price by revenues. The price-to-earnings ratio divides the price by earnings.
The median price-to-sales ratio on S&P 500 SPX, +0.43% —or the P/S of the 250th stock on the index—is at 2.2, according to Ned Davis Research, above the 2007 and 2000 levels, when stocks were arguably in bubble territory.
NDX breaks above Long-term resistance.
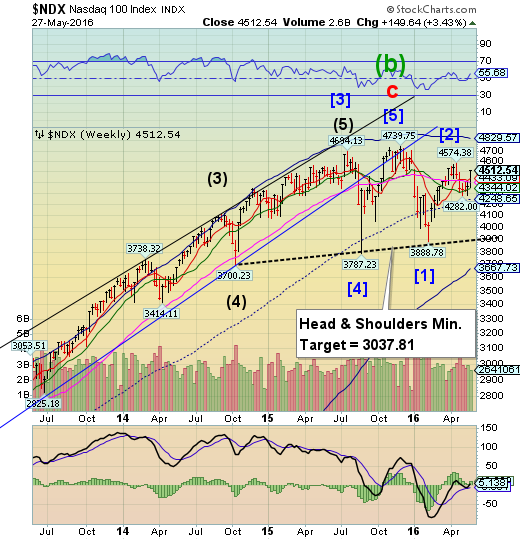
NDX broke above Long-term resistance at 4433.09 in a show of rare seasonal strength. However, this may be a false breakout, as a major pivot may be about to happen.Should the NDX turn without making a new high, the Head and Shoulders formation may be in play once NDX declines through its mid-Cycle support at 4248.65.
(ZeroHedge) For many weeks in a row now we have been asking, mostly jokingly, how with everyone else (both retail and "smart money") selling, and with stock buybacks sharply lower in recent months, is the market higher. Specifically, who is buying?
This question is no longer a joke. After this week's 17th consecutive outflow by "smart money" funds (mostly on the back of surging hedge fund redemption), moments ago we got the latest Lipper fund flow data. It was, as BofA put it, "unambiguous risk-off weekly flows."
High Yield Bond Index challenges a prior high.
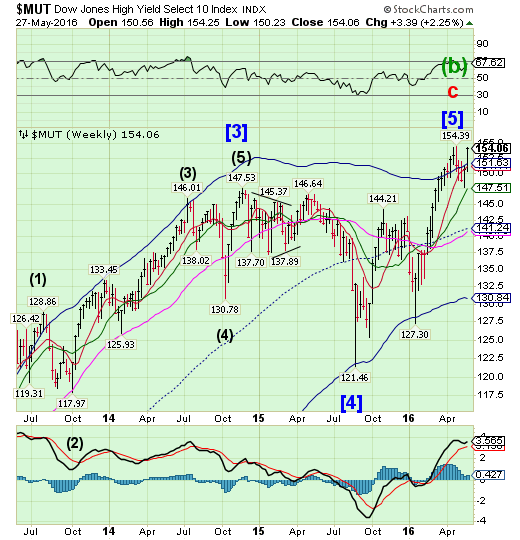
The High Yield Index challenged its April 27 high at 154.39, but did not exceed it. Note that it reacts to the same pivots as equities. Regardless whether it makes a new high, buying High Yield Bonds at this level may be the most wrong-headed mistake investors can make.
(MarketRealist) Investor flows into high yield bond funds were positive after two consecutive weeks of negative flows. According to Lipper, net inflows from high yield bond funds totaled $1.1 billion in the week ended May 18, 2016.
In the previous week, high yield bond funds had seen net outflows of $1.9 billion. With last week’s inflows, high yield bond funds have witnessed year-to-date (or YTD) inflows of $7.1 billion.
The euro is testing critical support.
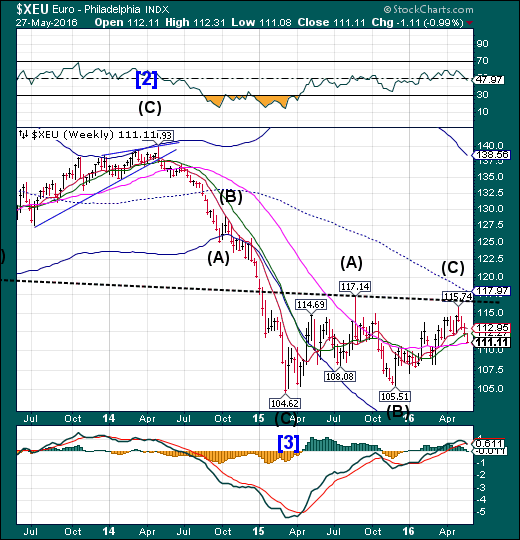
The euro declined to its Long-term support at 110.98 this week. A bounce may develop next week which may test the overhead resistance levels. However, it may not be capable of new highs.
(WSJ) Investors appear to have concluded that the U.K. will vote to stay in the European Union in June, leaving them exposed to steep losses should Britain elect to leave.
Opinion polls show Britain leaning toward a vote to stay in the EU in the June 23 referendum. Bookmakers have cut the odds on a vote to “leave” to 19% from 37% in April, according to Betfair Group PLC.
That shift appears to have reassured investors that Britain is staying in the EU. The country’s bond and stock markets have barely reacted to the possibility of a so-called Brexit. While the pound has fallen on the prospect, the currency began reversing that decline in late February.
EuroStoxx rallies above its consolidation.
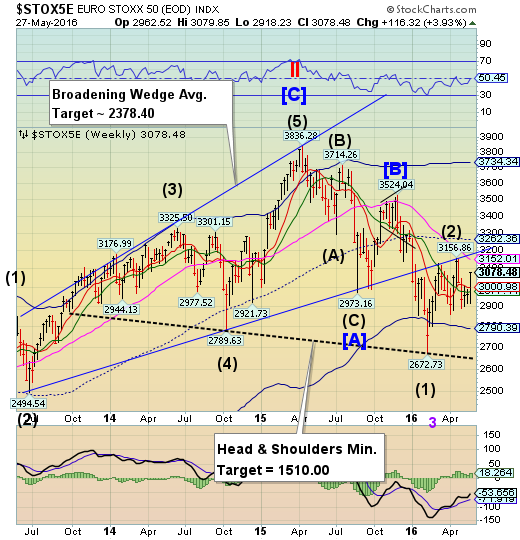
The EuroStoxx 50 Indexrallied above its consolidation, breaking above weekly Short-term resistance at 3000.98. The index may be off its sell signal, but it’s no buy, either. The prospect of a false breakout may arise as European equities may have overplayed its strength. A reversal pivot may be due early next week.
(Bloomberg) European stocks extended a third weekly increase, amid optimism that the economy is strong enough to withstand higher U.S. borrowing costs, as traders awaited a speech by Federal Reserve Chair Janet Yellen.
The Stoxx Europe 600 Index added 0.2 percent at the close of trading in London, taking its advance to 3.4 percent for the week. The number of shares on the gauge changing hands was about 20 percent lower than the 30-day average, before holidays in the U.K. and U.S. on Monday.
European shares posted their best weekly gains since February, resuming a rally that had stalled after a 16 percent rebound from a low that month. After hawkish comments from Fed officials, traders increased the chances of an interest-rate increase in June to 30 percent and to 54 percent for July. Data showed the U.S. economy in the first quarter expanded at a slightly faster pace than initially estimated, and Yellen is due to speak on Friday after the close of European markets.
The yen remains in its uptrend.
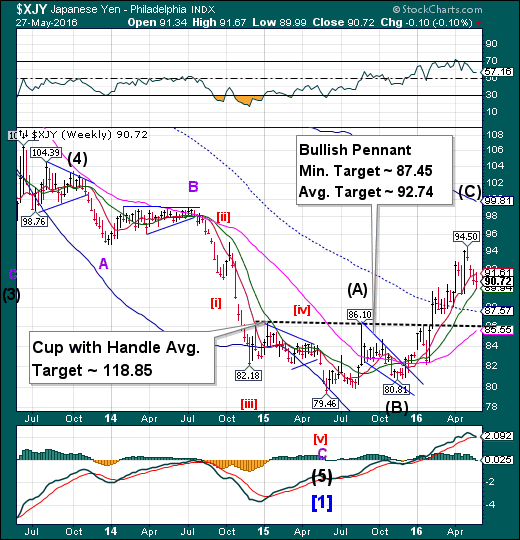
The yen bounced off Intermediate-term support at 89.94. Should it continue its bounce, the rally may extend for another month. The inverted Cup with Handle formation appears to be activated. While the Cup-with-Handle target may seem farfetched, the Cycle Top at 99.81 may be attainable as a minimum target.
(Bloomberg) Yukio Noguchi, a former Ministry of Finance official whose business books are best sellers, envisages a scenario in which a failure of Japan’s economic stimulus could drive the yen to weaken beyond 300 per dollar.
“If these fiscal and monetary policies continue, the yen’s value is at great risk,” the 75-year-old professor at Tokyo’s Waseda University said in an interview on May 11. “If you base your thinking on the efficient-markets hypothesis, you can’t predict a level for the currency. But, if the nation’s economic strength weakens, it is possible the yen could drop to 300, or 500, or 1,000 to the dollar.”
The Nikkei stays positive another week.
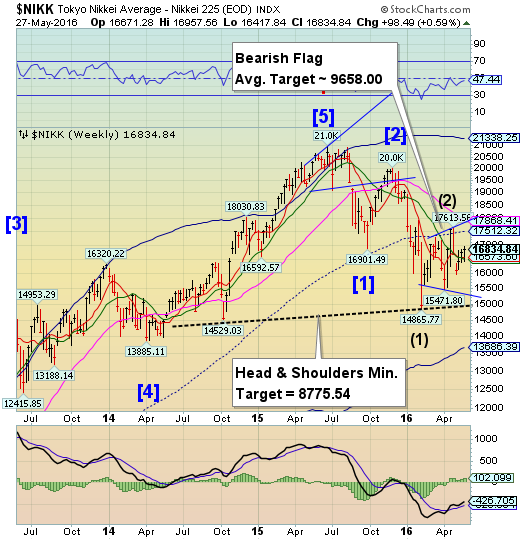
The Nikkei bumped the retracement to 60% as it moved higher this week. A decline beneath Intermediate-term support at 16573.80 may soon develop into a panic as the next support may be the Head & Shoulders neckline near 15000.00, followed by the Cycle Bottom at 13686.39.
(Bloomberg) Japan Prime Minister Shinzo Abe plans to propose a fiscal stimulus package of as much as 10 trillion yen ($90.7 billion) after warning Group of Seven leaders that the global economy faces significant risk of another crisis, according to the Nikkei newspaper.
Abe will seek a second supplementary budget worth 5 trillion yen to 10 trillion yen after July’s upper-house election, the Nikkei reported Saturday without attribution. Proposals will include accelerating the construction of a magnetic-levitation train line from Nagoya to Osaka, issuing vouchers to boost consumer spending, increasing pay for child-care workers and setting up a scholarship fund, the Nikkei said.
U.S. dollar continues testing Intermediate-term resistance.
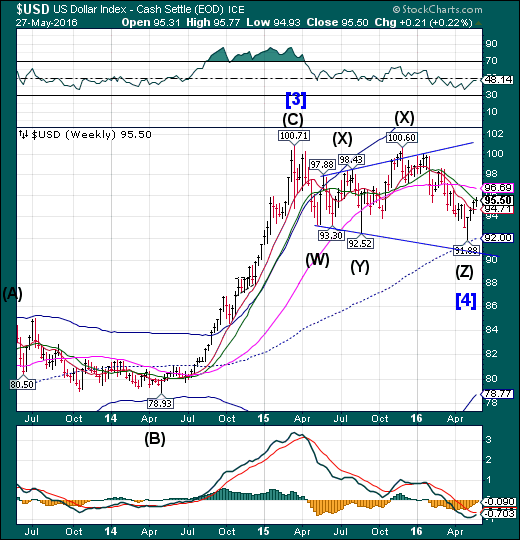
USD continued to challenge weekly Intermediate-term resistance at 95.51 as it finishes its bounce off mid-Cycle support. What may follow is a decline to retest the mid-Cycle low and possibly the lower trendline. The Cycles Model suggests the next low to occur in early June.
(HeraldSun) The US dollar index has hit a two-month high and US bond prices have fallen after Federal Reserve chair Janet Yellen said a US interest rate rise would probably be appropriate in the coming months.
Although they briefly trimmed gains on Ms Yellen’s remarks, US stocks ended higher on Friday and the S&P 500 capped off its strongest week since March.
MSCI’s all-country world stock index had its best weekly performance since mid-April.
“It’s appropriate ... for the Fed to gradually and cautiously increase our overnight interest rate over time, and probably in the coming months such a move would be appropriate,” Ms Yellen told an audience of Harvard University professors and alumni.
USB consolidates beneath Intermediate-term resistance.
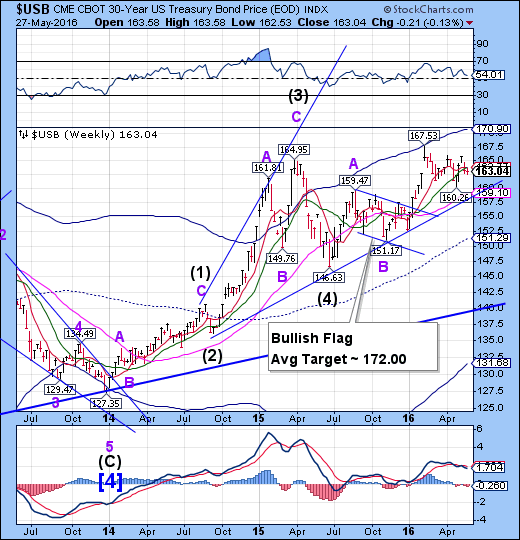
The Long Bond consolidated beneath Intermediate-term resistance at 163.71. The pullback may have ended on Wednesday, but we have yet to see a breakout. Bonds have not been this overpriced (historically lowest yields) in over 300 years.
(Bloomberg) A bout of selling hit the U.S. government bond market Friday as Federal Reserve Chairwoman Janet Yellen signaled that the central bank may be ready for an interest-rate increase this summer.
Ms. Yellen said Friday a rate increase would be appropriate “probably in the coming months” if the economy and labor market continue to strengthen. She joined a number of Fed officials who during the past few weeks have warned investors that a rate increase as soon as next month isn’t off the table amid a resilient U.S. economy.
Gold declines to mid-Cycle support.
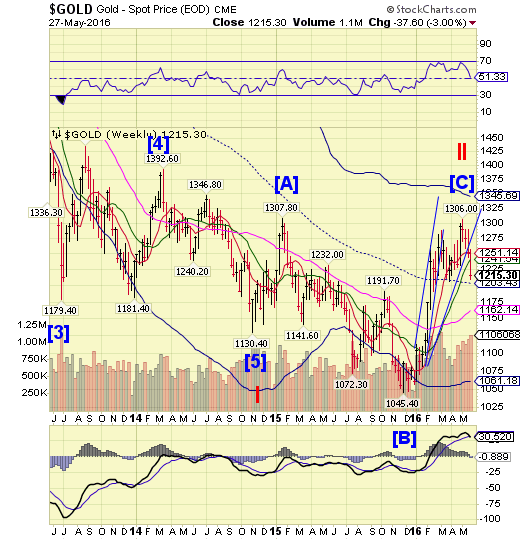
Gold declined toward mid-Cycle support at 1203.43, hitting a probable Master Cycle low of 1209.00 on Friday. It is now due for a short-term bounce that may take it back to Short-term resistance at 1251.14. At this point one may wish to sell the bounce rather than buy the dip.
(Bloomberg) Gold looks very different than it did at the beginning of May. Along with platinum, palladium and silver, it is heading for the biggest monthly loss since November as investors anticipate higher borrowing costs in the U.S.
Bullion has pared this year’s rally after retreating more than 5 percent in May as the dollar rallied and investors raised bets on the Federal Reserve increasing interest rates as early as next month. Higher rates curb gold’s appeal against interest-bearing assets. Chair Janet Yellen spoke on Friday at Harvard University, saying an increase in rates in the coming months may be appropriate. The comments come after a number of regional Fed presidents have indicated their willingness to tighten policy.
Crude challenges $50.00 .
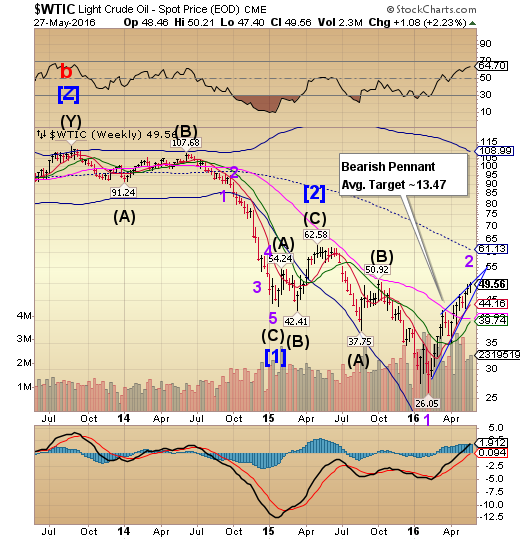
Crude rallied to 50.21 on Thursday, but could not close above the all-important $50.00 level. The Period of strength is due to expire with a potential three-week decline ahead. A decline beneath Short-term support and the Ending Diagonal trendline at 44.15 may trigger a sharp decline in crude.
(CNBC) Crude oil prices dipped on Friday, but the two-month trend upwards is seen continuing by oil expert Amrita Sen.
The co-founder and chief oil analyst of Energy Aspects told CNBC on Friday that cuts to supplies from non-OPEC countries would help balance the market in the coming months.
Non-OPEC supplies have declined by around 1 million barrels per day, according to Sen, largely due to unplanned outages in Nigeria and Canada.
"I think the secular trend is higher," she told CNBC in London.
Shanghai Index continues to consolidate beneath support.
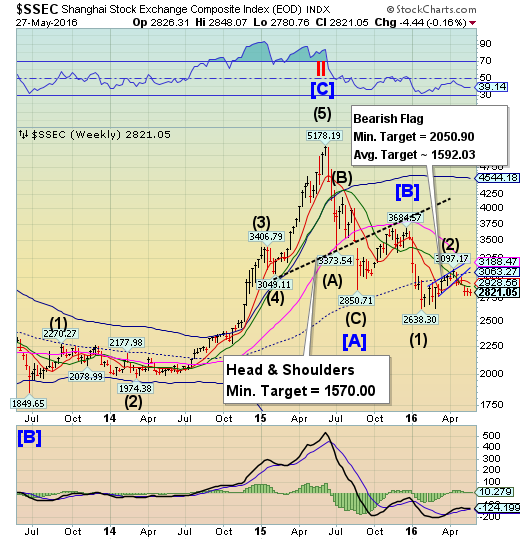
The Shanghai Index had another sideways consolidation week. A sideways market implies that it may continue its previous trend, once the consolidation completed. The sell signal in the Shanghai remains confirmed. There is no visible support beneath the prior low at 2638.30, while a significant low may not occur until the end of June.
(ZeroHedge) China's hard landing has already begun, warns economist Richard Duncan as the nation's credit-fueled economic boom ended in 2015 and a protracted slump lies ahead. He has published a series of videos explaining why China’s economic development model of export-led and investment-driven growth is now in crisis leaving "China’s economy resembles a spinning top that is running out of momentum. It is wobbling and gyrating erratically."
The Banking Index retests mid-Cycle resistance.
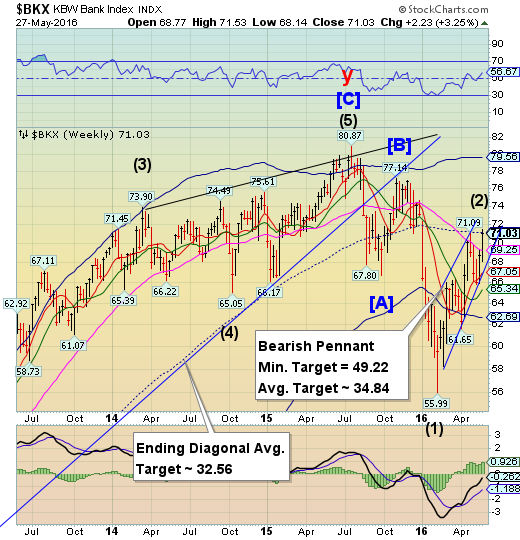
BKX challenged mid-Cycle resistance at 71.13, but was unable to close above it. The Pennant trendline and Long-term support at 69.25 are the keys to a resumption of the decline. Once broken, the Cycle Bottom support at 62.69 may not be capable of providing the next bounce, as it too is in decline. The next significant low may be due in mid-June.
(ZeroHedge) The SEC is taking a new approach to uncovering nefarious dealings within the financial markets: bar hopping.
In its new strategy to root out any underhanded dealings, the SEC is making an effort to attend more Wall Street conferences. The overall plan: catch Wall Streeters with their guard down at the bar in hopes that after a few drinks everyone will begin to ramble on about just how much screwing of the general public they are doing. Of course, nobody from the SEC is drinking at these conferences, that's against policy.
(ZeroHedge) In the wake of its recent $1.2 billion settlement with the government, whereby Wells Fargo (NYSE:WFC) admitted to deceiving the government into insuring thousands of risky mortgages (yet nobody went to jail), the bank has decided to break with the Federal Housing Administration and offer its own minimal down payment mortgage program.
The new program partners with Fannie Mae in order to allow borrowers with credit scores as low as 620 to make as little as a 3% down payment and use income from family members or renters to qualify. Naturally, the intent is to make more loans to low and middle-income borrowers - in the process pushing up home prices countrywide - without going through the FHA.
(ZeroHedge) Another day, another too-big-to-fail bank gets slapped on the wrist after being busted for blatant rigging of the market. The CFTC Order finds that, beginning in January 2007 and continuing through January 2012 (the Relevant Period), Citibank on multiple occasions attempted to manipulate, and made false reports concerning, the U.S. Dollar International Swaps and Derivatives Association Fix (USD ISDAFIX), a global benchmark for interest rate products. Notably, while a handful of European banks have already settled criminal or civil claims tied to Libor rigging, Citi is the first U.S. bank to do so.
(CBSNews) Cyber security researchers say North Korea might be connected to a recent attack that resulted in the theft of over $100 million from the Bangladeshi central bank and the attempted thefts of millions more from other Asian banks.
If the finding holds up, the attacks would amount to a new strategy for the rogue nation, whose state-sponsored efforts have long been motivated by politics, not money.
Security researchers at Symantec (NASDAQ:SYMC) say that the malware used in February to steal $101 million from the Bangladeshi bank's account in the Federal Reserve Bank of New York is similar to that used in the past by a group known as "Lazarus."
