Pessimism that a recovery in the global economy will not be able to withstand the global spread of coronavirus, provoked the worst weekly sell-off in U.S. equities since the 2008 crash. U.S. markets lost $3.6 trillion in value last week as investors fled to a small group of safer havens.
Demand for the Japanese yen and Treasurys increased, while both the dollar and gold sold off.
Enduring Negativity Loop?
The S&P 500, Dow Jones and Russell 2000 all closed lower on Friday, though the NASDAQ managed to eke out a small gain; nevertheless, each of the major U.S. indices slumped into correction territory as the trading week came to a close.
Stocks dropped for the seventh straight day on Friday, with the S&P plunging 12.6 percent. The Dow Jones Industrial Average plummeted 14%, to its lowest level since June. The NASDAQ dropped 12.5%, and the Russell 2000 was down 13%. By Thursday, American equities had already fallen more than 10%, the official figure for a slide to be considered a correction.
We've written repeatedly about there being "room for a correction." With that prediction fulfilled, the technicals are now indicating there could be a bounce, at least in the short-term.
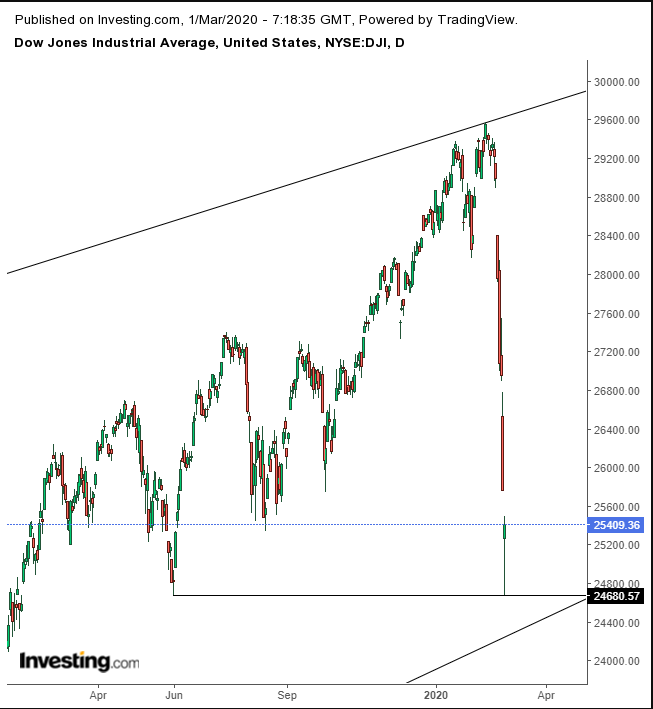
On Friday, the Dow produced a powerful hammer at the June 3 low, which also hits above the uptrend line since the February 2016 bottom—a point that happens to encompass the entire Trump trade.
To be clear, we're not saying the sell-off is over, no one can know that. Rather, the selling has reached a technical point that provides room for a bounce, to whatever degree or duration.
Of course, the fundamental problem remains Covid-19. Global economic growth is still in shock from the epidemic and company earnings are taking a hit, the result of supply chain disruptions and rising costs as workers are furloughed and factories closed.
Overlaying all this are the unsettled financial markets, leading to pockets of illiquidity, provoking the stress selling we’ve been experiencing. Unfortunately business and financial conditions feed into each other; right now they're creating an enduring negativity loop.
We’re looking for the formation of a bottom, which has not yet taken place. However, some investors, in search of the big score, will likely take the risk of riding a potential rebound that could be as violent as the freefall that preceded it.
On the final day of weekly as well as February trade, the S&P 500 declined 0.8%, trimming losses of more than 3% during the final 15 minutes of trading. The benchmark index still dropped for a seventh day, its longest slide since 2016.
Bank shares underperformed. JPMorgan Chase (NYSE:JPM) sank by more than 4%. This fits with the financial disruption we discussed above, as liquidity evaporates. Funding may dry out as lenders assume defensive positions, something that was done during the 2008 financial crisis.
All of which may force the Fed to cut rates as a way of trying to ease credit, though probably moreso to placate markets since the U.S. central bank already knows such a move won’t have any lasting effect. A move such as that would lead Europe and Japan to punish banks with even deeper negative interest rates. Could that be where the U.S. is ultimately heading as well?
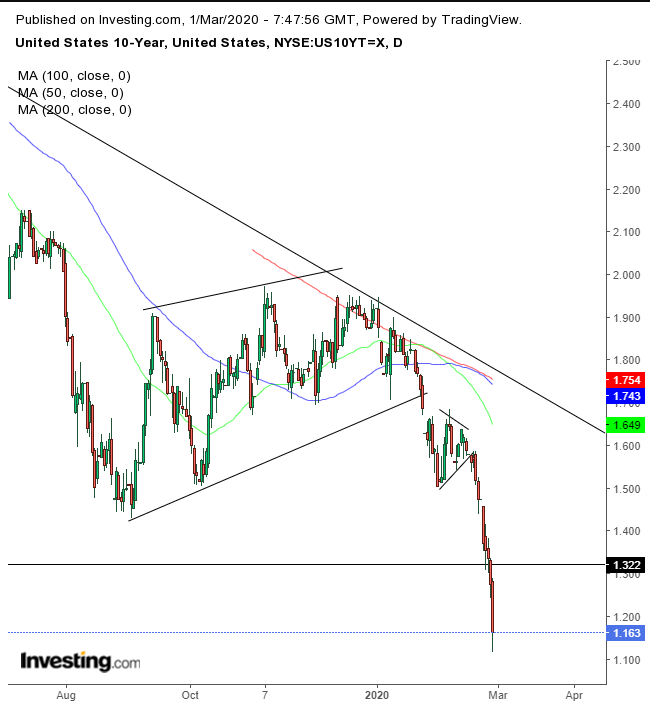
Yields on the U.S. 10-year Treasury plunged, taking them deeper into uncharted territory, after having fallen below the previous record low of July 2016. This was before the election of Donald Trump reawakened the market’s Animal Spirits.
Right now, however, a death cross suggests there are more potential declines ahead for rates, which have actualized the drop implied by the previous two patterns.
The U.S. dollar also had a terrible week. The global reserve currency fell 1.75% in four out of the last six sessions, after its Feb. 20 high saw the greenback hit the highest point since Apr. 21, 2017.
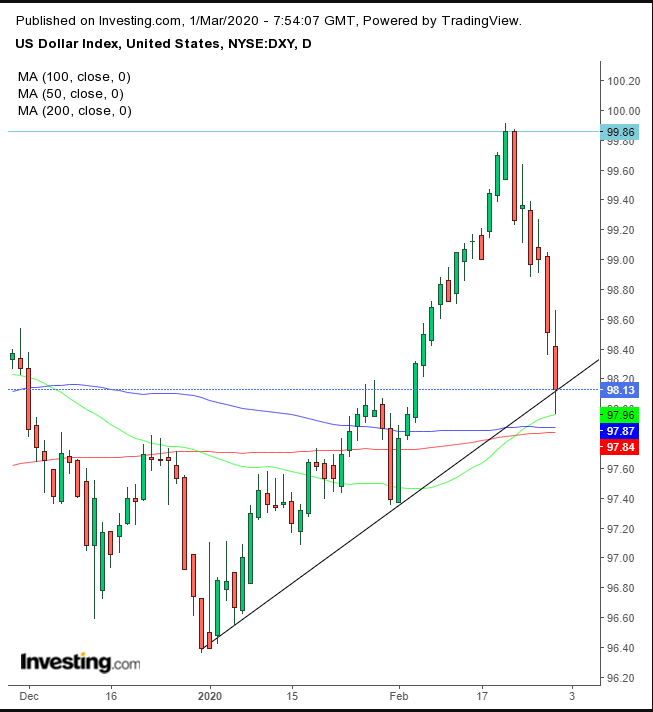
However, the sell-off provided an opportunity for the uptrend line since the beginning of the year to prove itself, and it didn’t undo a golden cross.
Gold was annihilated on Friday. The yellow metal experienced its worst plunge since 2013. This is nothing less than shocking given the obvious risk-off sentiment currently pervading markets. What’s more, the USD plunged at the same time, making gold even cheaper.
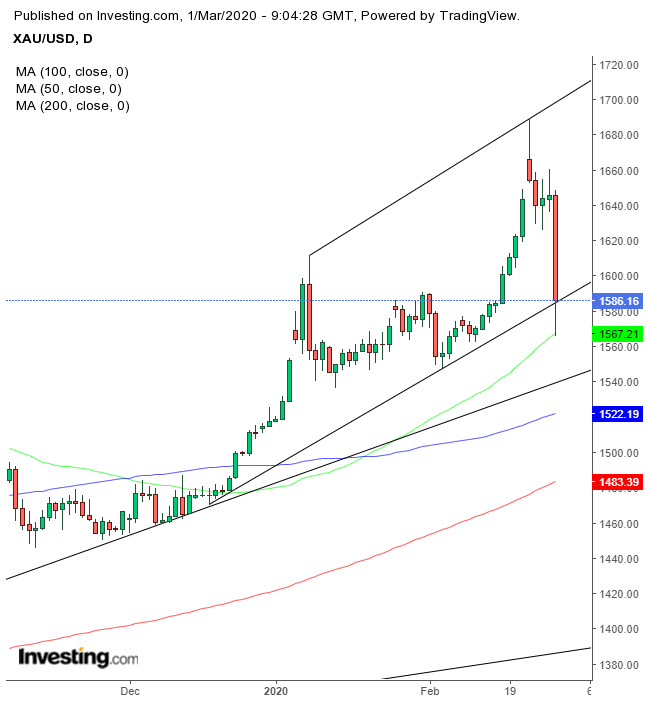
This indicates an irrational selloff—one we can only attribute to profit-taking gone bad. However, the price's obvious support by both the 50 DMA and the uptrend line since mid-December suggests the panic-driven repositioning is over.
On the other hand, if we’re right about a possible equity bounce, gold is likely to fall the next uptrend line.
Oil dived for the seventh straight session, dropping 16.3% in total. It was the worst week for commodity since the financial crisis. Black gold is now closer to $40 than to $50, as predicted last week.
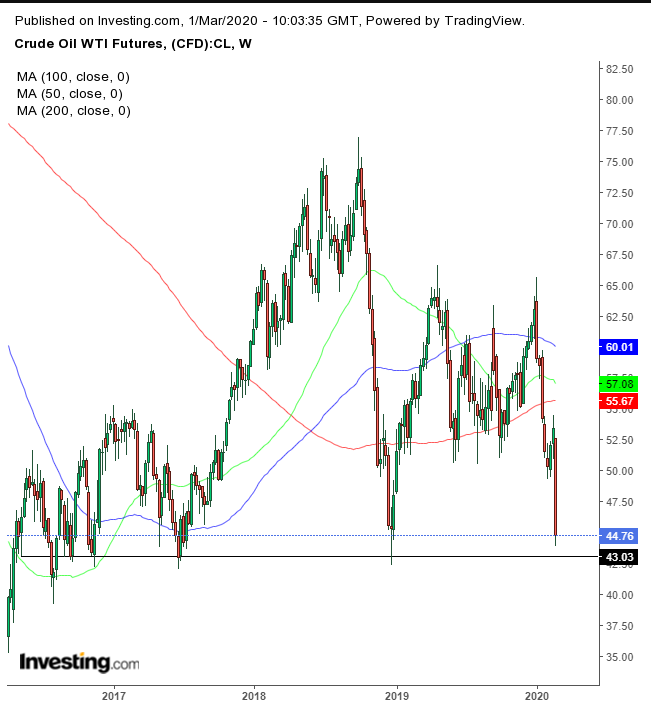
WTI is reaching a staunch support line, in place since 2016. Will it endure, sending prices back to retest the $52 levels—the 2019 lows? Or will we witness a reversal, and a return to the 2016 lows of $26?
Week Ahead
All times listed are EST
Sunday
20:45: China – Caixin Manufacturing PMI: expected to have plunged to 45.7 in February, deep within contraction territory, from 51.1 the previous month.Monday
3:55: Germany – Manufacturing PMI: predicted to remain flat at 47.8.
4:30: UK – Manufacturing PMI: seen to edge down to 51.8 from 51.9.
10:00: U.S. – ISM Manufacturing PMI: probably declined to 50.4 from 50.9.
22:30: Australia – RBA Interest Rate Decision: the central bank is expected to hold at 0.75%, but has the virus changed policy makers’ views?
Tuesday
4:30: UK – Construction PMI: expected to remain at 48.4.
5:00: Eurozone – CPI: seen to decline to 1.2% from 1.4% YoY.
19:30: Australia – GDP: expected to remain flat at 0.4% QoQ.
Wednesday
4:30: UK – Composite and Services PMIs: each is anticipated to remain flat, all at 53.3.
8:15: U.S. – ADP Nonfarm Employment Change: forecast to plunge to 170K from 291K.
10:00 U.S. – ISM Non-Manufacturing PMI: predicated to drop to 54.9 from 55.5.
10:00: Canada – BoC Interest Rate Decision: the central bank had been expected to hold 1.75% but the virus may have reshuffled policy.
10:30: U.S. – Crude Oil Inventories: anticipated to have dropped to -0.079 from a gain of 0.452M last week.
Thursday
5:00: U.S. – OPEC Meeting: the two-day meeting of OPEC member countries plus OPEC+ countries kicks off in Vienna, amid plunging oil prices.
Friday
8:30: U.S. – Nonfarm Payrolls: seen to have fallen to 175K from 225K.
8:30: U.S. – Unemployment Rate: expected to remain steady at 3.6%.
