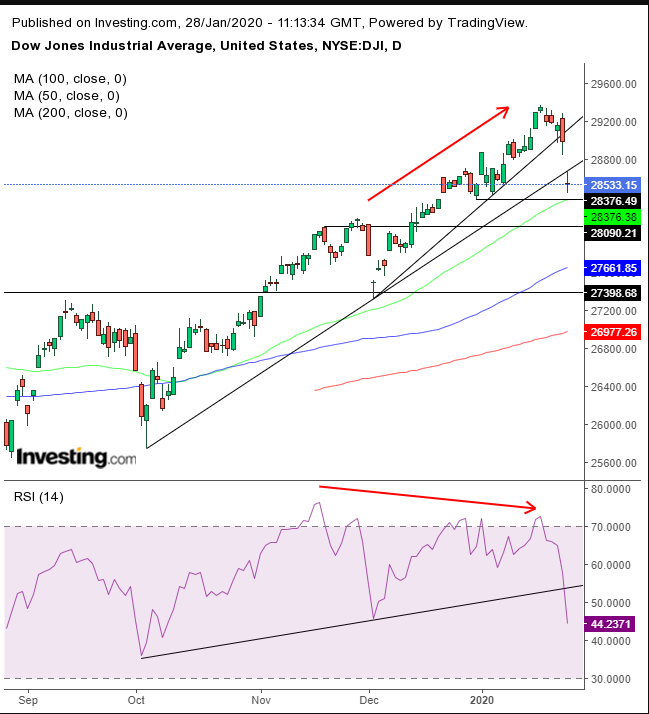
The Dow Jones Industrial Average fell 1.57% yesterday, the sharpest drop since Oct. 1, wiping out all its 2020 gains. The combination of a deadly virus — whose potential damage to the economic bounce recently seen around the world is still unknown — and the recent exuberant rally resulted in the sharp selloff.
We think the retreat may be overblown, considering that “previous viral outbreaks around the world have ultimately not made a significant dent in economic and market performance…” However, we also believe that there is still room for a correction.
The index’s chart just triggered two bearish signals.

Even if the Dow opens 0.3% higher as futures suggest, it would still be below its broken uptrend line. Not only did the price fall below its uptrend line since the Dec. 3 low, but it also dropped underneath the uptrend line since the Oct. 3 bottom.
Note how the intraday high attempted to climb as the longer uptrend line resisted its advance. Two mitigating factors, however, are the 50 DMA — guarding the Dec. 31 lows — that supported the day’s lows and the closing price being the same as the opening price, forming a high wave candle. The one-session pattern denotes a lack of certainty in the direction and often appears before reversals, which in this case, would mean a rebound.
The RSI dropped below its uptrend line since Oct. 1. Moreover, it provided a negative divergence, which successfully called the ensuing decline, when the momentum dropped against a rising price between the Nov. 18 and Jan. 17 highs.
If the 28,375 Dec. 31 lows give way, the gauge is likely to target the 28,000 level — the broken late November, early December resistance. The next major support is 27,400: the Dec. 2 low that confirmed the support of the broken resistance of July and September.
Trading Strategies
Conservative traders would either wait for a descending series of peaks and troughs — for a bona fide reversal, before risking a short position — or they would wait for new highs and then a correction that remains above the uptrend line, in order to join it.
Moderate traders would wait for yesterday’s high wave candle’s potential reversal signal to be nullified with a lower low, with a close below the 28,375 levels — the Dec. 31 lows — and then play the support-resistance levels specified above.
Aggressive traders may enter a very short-term long position, counting on a temporary buying dip after yesterday’s sharp drop and today’s news of global efforts to rein in the virus outbreak, before joining moderate traders with a short, when finding resistance at the 28,800 level.
Trade Sample – Short Position Setup
