- Investor fears increase on pressure from rising yields forcing Fed to hike earlier than promised
- Dollar rebound to continue?
- Bitcoin hits new record on thinner weekend trade
Without doubt, yields have been the most recent catalyst for stocks—but whether headwind, tailwind or just simply whirlwind depends entirely on timing. Most equities rose along with yields on Friday, but investors have to be wondering how long this can continue.
After a breathtaking Treasury selloff on the final day of last week's trade pushed yields on the 10-year benchmark above 1.62% for the first time since Feb. 12, the S&P 500 pressed higher, finishing the week at a fresh record. The Dow Jones Industrial Average also hit a new high on Friday, capping off its best week since November.
The move on Friday wiped out the plunge in yields triggered a year ago by the coronavirus pandemic. Investors are now selling off current Treasury issues since they expect the Fed may have to raise rates as early as 2022. They anticipate the US central bank will be foreced to break its promise, repeated relentlessly, that rates will not be hiked until the end of 2023.
Meanwhile, shares that have gained the most in the last year, when the economy was pressured by the worst global health crisis in a century, were mostly tech sector equities listed on the NASDAQ. These stock are now considered overvalued and are being dumped by investors as yields begin to rise.
The chart below shows the disparity between the major US benchmarks and how they've fared relative to rates.
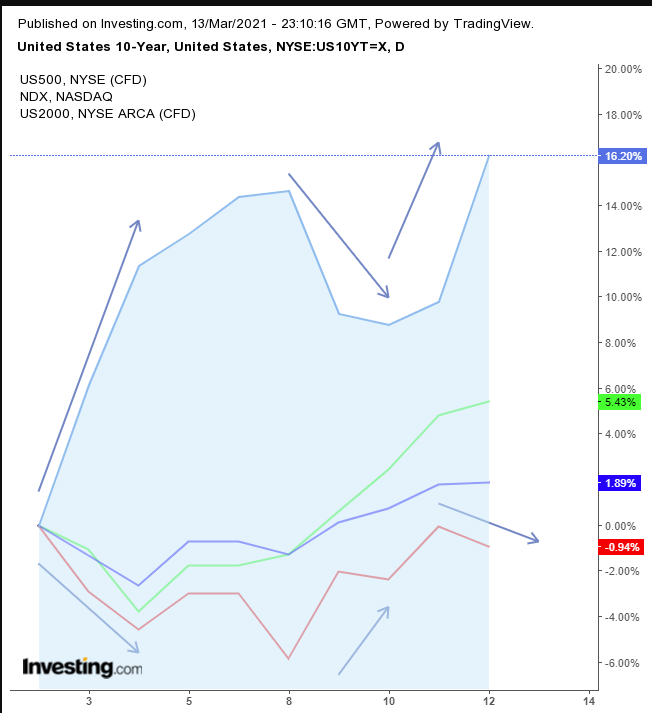
Stocks generally move in the opposite direction of yields, as rising rates consistently raise fears that escalating inflation and accelerating interest rates could deflate an economic recovery.
Note, however, that the tech heavy-NASDAQ 100 (red) appears to posses the strongest negative correlation with yields, while domestic firms listed on the Russell 2000 (green) have suffered fewer selloffs amid rising rates, which have been appreciating in almost a straight line since the Mar. 3 dip. The SPX (blue) is somewhere in the middle.
It appears likely, based on recent evidence, that the technology sector, which benefited the most from the stay-at-home environment fueled by COVID, could suffer the most as the economy reopens thanks to a new wave of stimulus, as well as the continued vaccine rollout and easing rates of contagion.
Last week we provided a bearish call on the NASDAQ 100, but cautioned that the index may rebound. Nevertheless, we still think the NDX is likely to head lower.
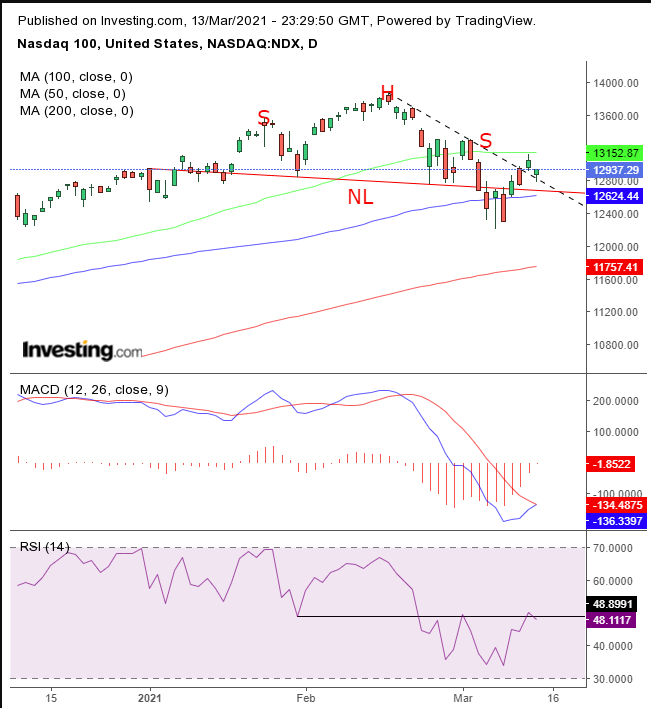
While the price climbed back above the neckline of a H&S top, the RSI could not. It has found repeated resistance at that level. The MACD's short MA attempted to cross above the long MA but has so far been unable to do so.
Still, the two sides of the supply-demand balance remain at war. The price pared losses on Friday, closing well off the lows, just at the point where the (dotted) downtrend line from the head is. Note that the price has been trapped between the 50 and 100 DMAs.
In our post of last week, we observed that the equal distances between the 50 and 100 DMAs to the 100 and 200 DMAs appears significant, and the next power struggle could be in that next MA area. While the price went up rather than down, it's still trapped within the same technical pressure points.
So, while the NASDAQ slipped on Friday, the remaining three major averages all reached new records.
As well, even as yields are weighing on tech stocks, rates look to be headed higher.
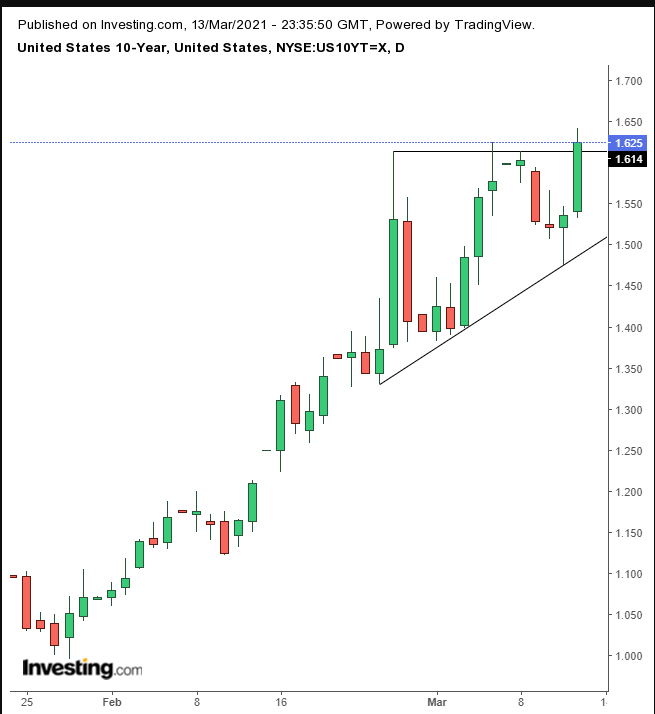
It’s clear in the chart that the 1.6% level is a technical milestone; yields may have completed an ascending triangle. Given that rates posses a negative correlation with bonds, we should view this as a descending triangle for Treasuries, suggesting a continued selloff—pushing yields higher still.
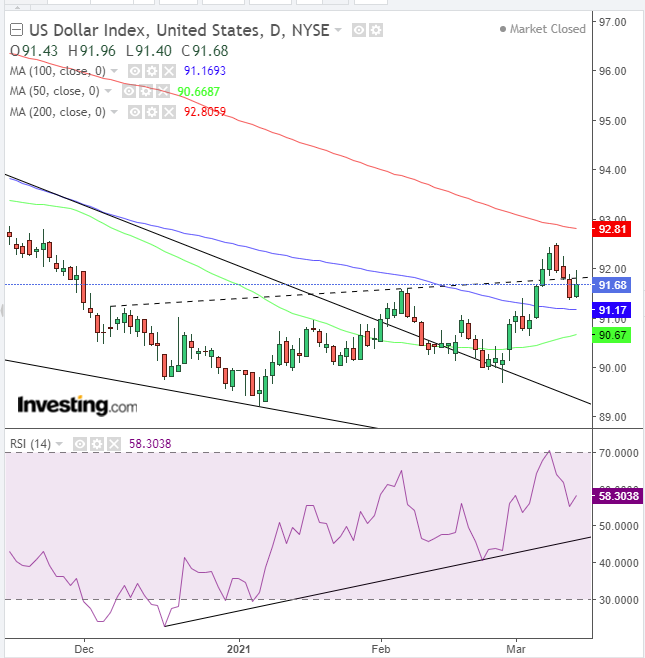
On Friday, the dollar rebounded from a three-day selloff. Is the head of the USD's technical pattern gearing up to continue its uptrend from the Jan. 6 bottom?
Source: TradingView
The greenback completed a falling wedge since the March high, but it appeared to slip below the (dotted) neckline of a potential double-bottom.
Notice how the global reserve currency gave up Friday’s daily highs, finding resistance at the neckline. On the other hand, the RSI signals that the currency's momentum is on the rise, in support of the wedge and therefore the double-bottom. After the price took over the 50 and 100 DMAs, with the 50 DMA pulling up as well, it looks like the dollar will take on the 200 DMA.
Gold fell on Friday for the second day, as the yellow metal struggled to enter an upward correction within its falling channel since the March high.
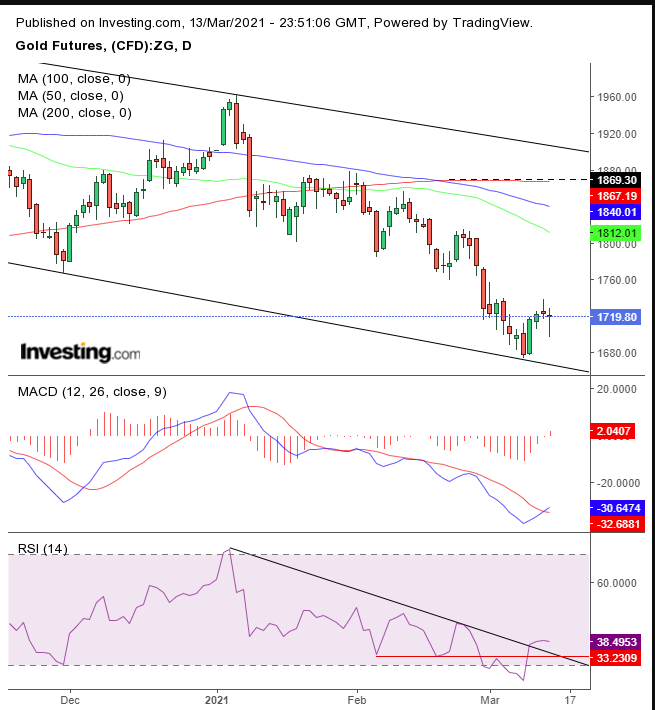
While the RSI and MACD appeared to bottom, the 200 DMA has started curving downward, increasing its Death Cross signal, triggered in January. While aggressive traders will buy the dip, conservative traders will likely avoid entering a long position within a bearish channel.
Bitcoin made history yet again on Saturday, trading above $60,000 for the first time, closing at the very top of the session to boot.
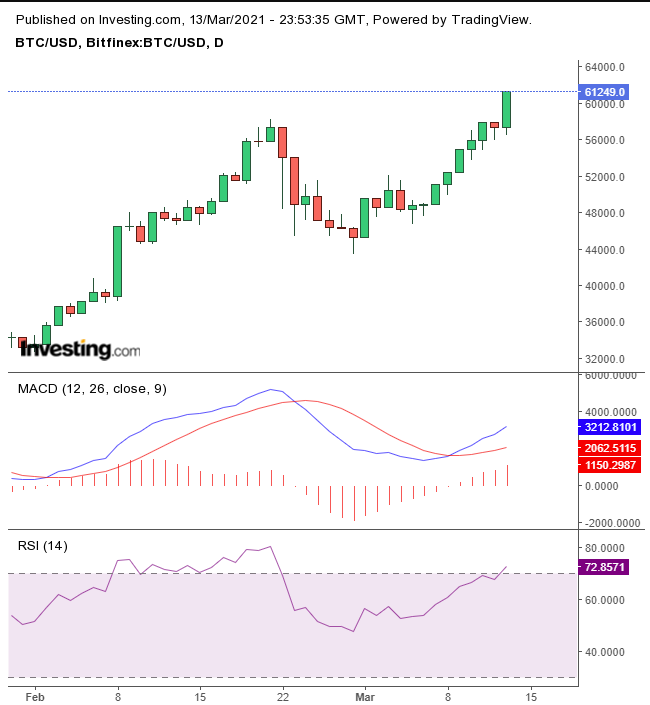
While both the cryptocurrency's RSI and MACD provide plenty of runway higher before concerns of overbought conditions come into play, it’s important to remember that it’s easier to move the price during the weekend, when trading is thinner.
Oil fell below $66 on Friday, as the commodity's short-term momentum weakens.
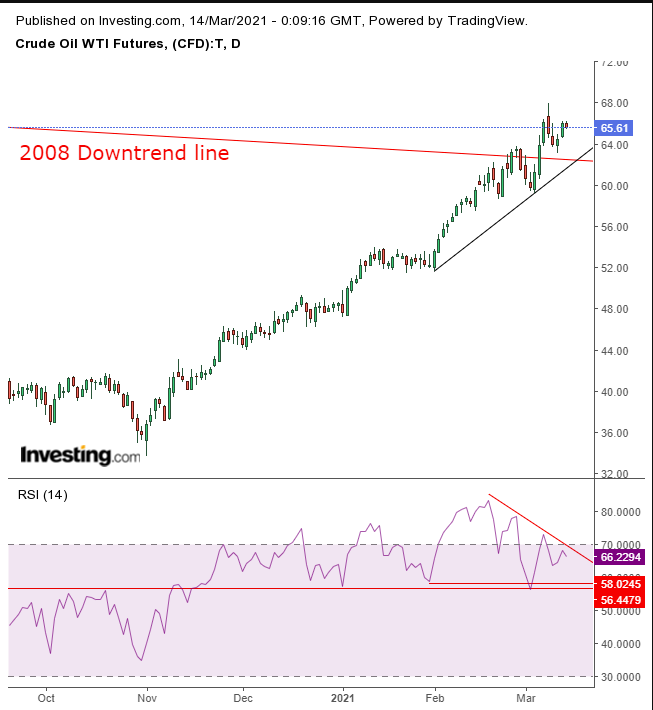
This can be seen with the RSI’s negative divergence, after crude overcame the downtrend line since the 2008 top. Such historical crosses tend to cause volatility, making it tricky to time short-term trades. The long view is looking higher.
Week Ahead
All times listed are EDT
Sunday
21:00: China – Industrial Production: expected to surge to 30.0% from 7.3%.
Monday
19:30: Australia – RBA Meeting Minutes
Tuesday
5:00: Germany – ZEW Economic Sentiment: seen to rise to 74.0 from 71.2.
7:30: US – Core Retail Sales: probably dropped to -0.1% from 5.9%.
7:30: US – Retail Sales: anticipated to plunge to -0.6% from 5.3%.
Wednesday
5:00: Eurzone – CPI: predicted to remain flat at 0.9% YoY.
7:30: US – Building Permits: expected to decline to 1.750M from 1.866M.
7:30: Canada – CPI: likely edged higher, to 0.7% from 0.6%.
9:30: US – Crude Oil Inventories: forecast to plummet to 0.816M from 13.798M.
13:00: US – Fed Interest Rate Decision: anticipated to remain steady at 0.25%.
Thursday
7:00: UK – BoE Interest Rate Decision: forecast to stay at 0.10%.
7:30: US – Initial Jobless Claims: anticipated to dip to 705K from 712K.
7:30: US – Philadelphia Fed Manufacturing Index: seen to remain flat at 23.1.
Friday
5:30: Russia – Interest Rate Decision: expected to remain at 4.25%.
7:30: Canada – Core Retail Sales: to rise to -2.8% from -4.1%.
