Yields continue to dominate the market discourse. A Treasury selloff increases the difference between their falling prices and their fixed yield, causing the rate to rise. Investors sell Treasuries when they expect the prices for goods and services to go up, a phenomenon known as “inflation” in professional lingo.
The current market narrative says “helicopter money,” when central banks and regulators hand over cash directly to citizens—recently, fiscal aid for pandemic-hit citizens in the form of Trump administration stimulus,which will now be followed by an additional $1.9 trillion from the Biden administration—will cause inflation to rise.
And judging by current moves on futures for the NASDAQ, the underlying index could become inflation's first serious target.
Given that big tech companies, most aptly represented by those listed on the NASDAQ 100, saw massive inflation in value during social restrictions caused by the COVID-19 pandemic, they are now the first to be pressured as equities sell off. Big tech shares have been condemned for being overvalued for a while, so this new, broader risk provides investors the opportunity to quickly take profits, while they consider other areas of the market, which provide more value. That includes beaten down sectors such as energy, tourism and leisure and banks.
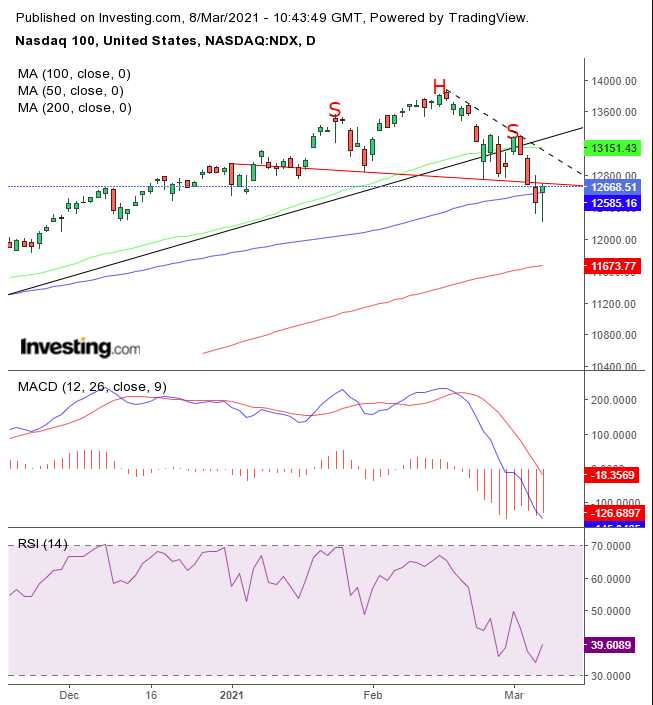
Technicals are signaling the tech selloff may have only just gotten started.

While NASDAQ futures suggested an extended selloff for the underlying gauge, note that Friday’s trading produced a hammer, whose bullishness is confirmed with a close above the 100 DMA. While that shows there's still bullish energy, along with a potential rebound in the MAD and RSI, dip buyers should recognize that the price just completed a small H&S top, whose neckline is just above Friday’s close.
The reversal pattern pushed the price below the uptrend line since the March bottom for the first time, suggesting it could garner more attention than that of the S&P 500, for example, which has had numerous readjustments.
While we may witness a rebound, we expect the tech-heavy index to repeat its move lower between the 50 and 100 DMAs toward the 200 DMA.
Trading Strategies
Conservative traders should wait for the price to close below the hammer low, then for a corrective rally, allowing the MACD and RSI to rise. Ideally, they’d wait for the indicators to be overbought, but with the price’s proximity to the reversal pattern and the dotted downtrend line we don’t expect there will be a chance for that, if we’re right and the index will, in fact, extend the selloff.
Moderate traders would wait either for a return to the dotted line, with evidence of resistance, or for a break of the hammer, then wait for a return-move for a better entry, if not for added confirmation on the reversal.
Aggressive traders could short at will, provided they read this post in its entirety, understand and accept the elevated risks of a potential premature short before reinforced confirmation. Money management is crucial.
Here’s an example:
Trade Sample
- Entry: 12,700
- Stop-Loss: 13,000
- Risk: 300 points
- Target: 11,800
- Reward: 900 points
- Risk:Reward Ratio: 1:3
