- Stocks expected to keep swinging violently as investors try to come to grips with how much of the slowing economy is priced in
- Riyadh and Moscow at diplomatic stalemate, each blaming the other for the oil production crisis
Weak economic data and extended social distancing guidelines, likely to be in place for longer than expected, all weighed on markets as trade on Friday concluded. U.S. and global equities retreated, pulling back from their strongest rebound in 11 years which was spurred by the most generous Congressional spending bill in U.S. history. The S&P 500, Dow Jones and NASDAQ each finished lower on the day by more than 1.5%.
Ultimately however, it's the reality of the continuing spread of COVID-19, with more than 1,203,000 confirmed cases worldwide and almost 65,000 deaths globally at time of writing, and no vaccine or other cure in sight, that will continue to trigger risk appetite—or the lack thereof—as investors consider the depth and breadth of both macro and micro economic damage the pandemic is creating across the globe. Expect continued volatility and perpetual whipsawing as long as the spread of coronavirus continues unabated.
Unemployment, Oil Price Biggest Stories Of The Week
The U.S. jobs market is clearly taking a hit. After Thursdays staggering intial jobless claims print showed that more than 6.65 million American's had filed for unemployment benefits for the first time during the previous week (following the previous week's shocking 3million+ initial claims report), Friday's nonfarm payrolls release indicated that the U.S. economy had lost more than 700,000 jobs in March, lifting the country's unemployment rate from all-time lows. And unemployment will continue to rise, given that 10 million Americans have already filed for unemployment benefits in the last two weeks. Countries like Italy and the UK seemed to care more about the economy, but when they realized that if they have a population infected with a deadly virus, it will hit the economy, just the same, not to mention voters.
The S&P 500 declined for the third day out of four on Friday fueled by the dire jobs data. The broad U.S. benchmark dropped 2.1% for the week, still holding most of the gains from the previous week, though the uptick was trimmed to 8% from 10.25%. Energy outperformed (+5.29%), tracking the oil market; Utilities lagged all other sectors (-6.99%).
From a technical perspective, the SPX is trading within a rising flag, bearish after the 30% plunge, the speediest on record, that previously stopped the globalized market in its track. The fact that it’s the fastest such plunge on record only packs in more of a punch into the pattern. Its downside breakout is thus expected to be even more explosive.
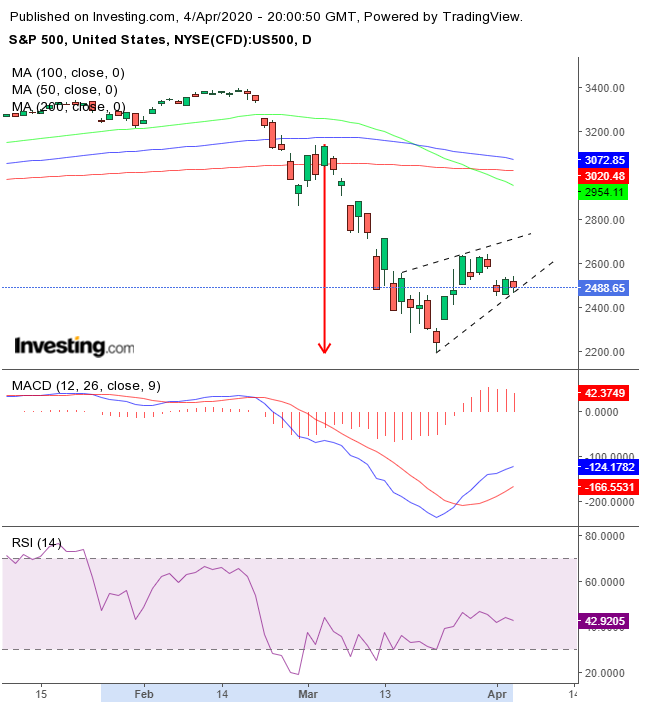
The low MACD and RSI also provide more room for the price to extend higher within the continuation pattern, on short covering and erroneous dip-buying till all the demand will be drowned by supply, propelling prices lower.
Treasury yields, including for the benchmark 10-year note, fell for a second week, after completing a bearish flag.
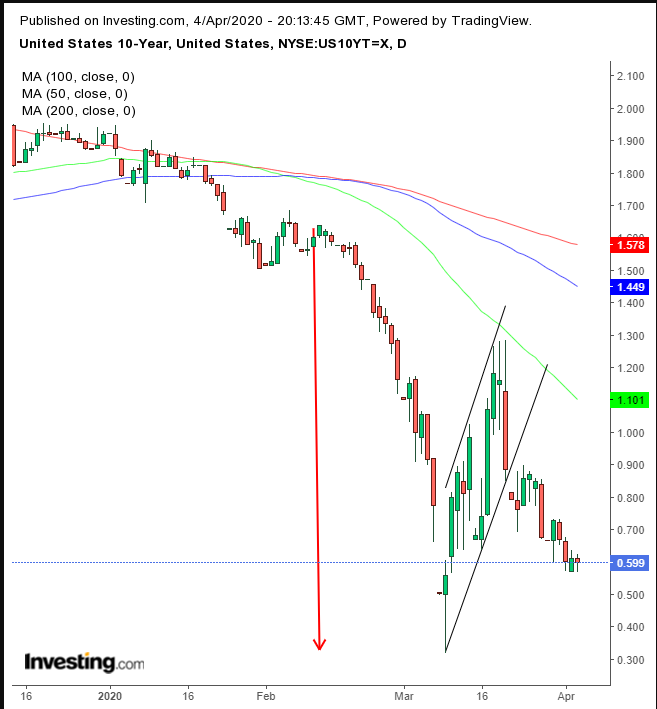
The downside breakout is supposed to repeat the preceding decline, a drop of 79%, from Feb. 12 through March 9.
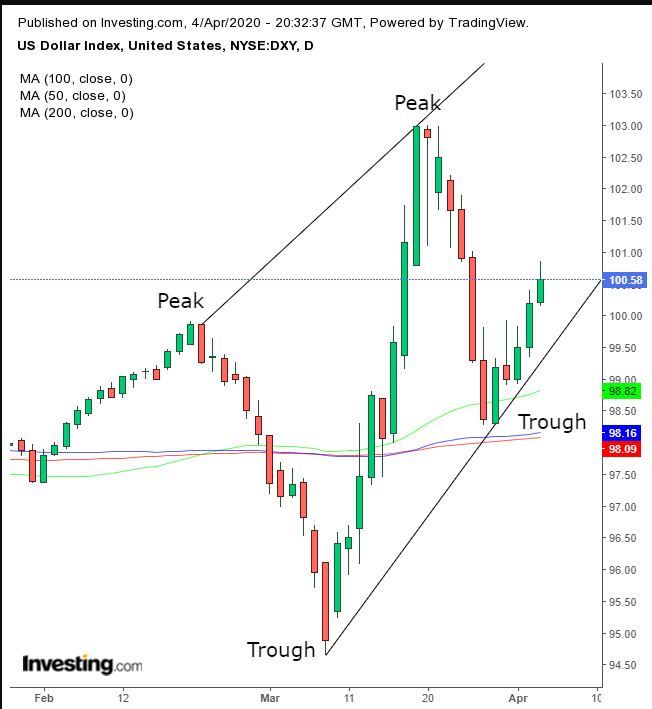
The U.S. dollar climbed for four of the five days last week, rendering the March 27 low the final trough from which to establish an uptrend.
Gold futures have pulled back after surging 8.9% during the preceding week.
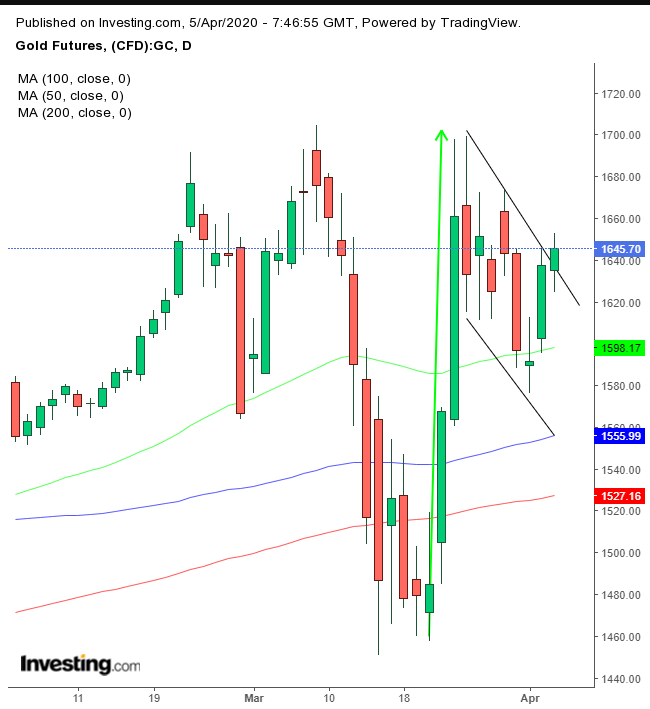
Technically, the contract is forming a falling flag, bullish following the preceding rally. An upside breakout would signal another leg higher, taking on the $1,700 level, in place since 2012.
Crude oil remained a primary focus, as wild price swings endured throughout the week. The commodity surged 32% on hopes of an agreement between Saudi Arabia and Russia to reduce production, boosting prices. WTI added 13% on Friday after catapulting nearly 25% on Thursday, a nearly 40% leap in just two days.
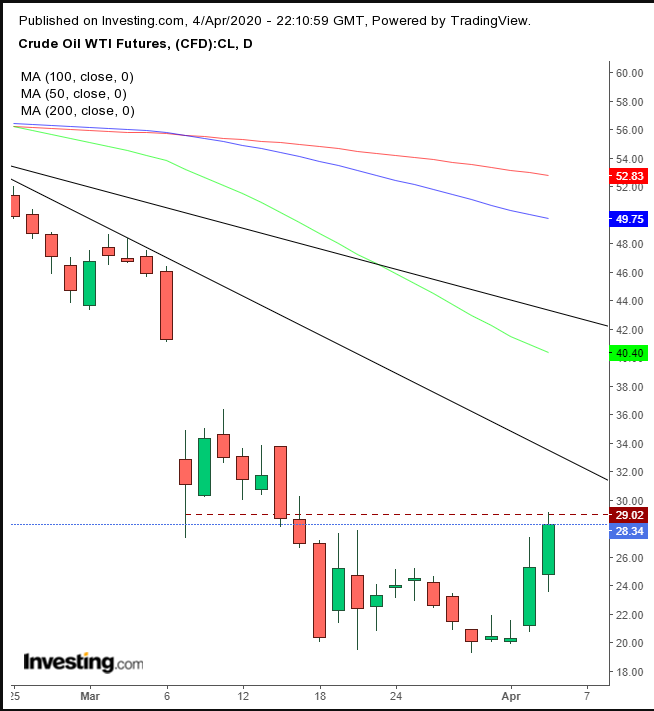
However, the positive outlook was mired by doubts about whether the two will actually be able to come to some accord, along with the release of economic activity data that signal a sharp decline in global growth. Since Friday, the planned April OPEC+ meeting has been postponed with no set date for a meeting as Russia and Saudi Arabia each point fingers at the other for the oil market’s worst conditions in decades.
From a technical standpoint, the price closed below the $30 resistance, as it neared a downtrend line.
Week Ahead
All times listed are EDT
Monday
4:30: UK – Construction PMI: expected to fall to 44.0, considered contraction mode, from 52.6 in February.
Tuesday
00:30: Australia – RBA Interest Rate Decision and Statement: anticipated to remain flat at 0.25%.
10:00: U.S. – JOLTs Job Openings: forecast to fall to 6.476M from 6.963M.
10:00: Canada – Ivey PMI: printed at 54.1 in February.
Wednesday
8:15: Canada – Housing Starts: expected to fall to 165.0K in March, from 210.1 in the previous month.
10:30: U.S. – Crude Oil Inventories: weak demand led to an increase of 13.834 million barrels in U.S. stockpiles last week.
Thursday
2:00: UK – GDP: seen to have risen to 1.1% from 0.6% YoY.
2:00: UK – Manufacturing Production: probably remained flat at 0.2% MoM
7:30: Eurozone – ECB Publishes Account of Monetary Policy Meeting
8:30: U.S. – Initial Jobless Claims: expected to show an additional 5,000K new filings after last week's whopping 6,486K claims.
8:30: U.S. – PPI: probably rose to -0.3% from -0.6%.
8:30: Canada – Employment Change: anticipated to have plunged to -350.0K from 30.3K
Friday
8:30: U.S. – Core CPI: forecast to decline to 0.1% from 0.2%; the headline number is expected to have dropped to -0.3% from 0.1%.
