- Renewed virus fears pressured stocks, overshadowing stellar NFP
- Though all fell on Friday, SPX, Dow jumped 3% for the week, NASDAQ gained 4%
- Multiple technical triggers flash warning signs for equities
- Dollar climbs but weakens vs yen
Renewed concerns over the economic impact of the coronavirus outbreak—which continues to spread and has now surpassed the number of fatalities from the 2002 SARS epidemic that also emerged from China—overshadowed the strong employment data released on Friday in the U.S. The Dow Jones, S&P 500, NASDAQ Composite and Russell 2000 all slumped. Wall Street's major indices closed lower on the final day of last week's trade, ending a four-day straight advance.
Notwithstanding the day's negative close, the indices still posted their most profitable week in eight months.
Rising Infection Rate Offsets Employment Beat, Phase One Commitment
News of the rising number of infections obscured the much stronger-than-expected employment growth, said to give the “economy an upbeat start to the year.” The 225,000 new jobs created in January smashed the 160K expectation.
Other geopolitical developments that should have boosted equities: Presidents Donald Trump and Xi Jinping held a phone call Friday, reaffirming their commitment to carrying out the first phase of an overall deal to end the trade war between their two nations that's been going on for nearly two years.
Nevertheless, coronavirus fears are back at the top of investor worries. Known cases of the illness have now topped 37,000 globally, with the death toll currently at 813. The Federal Reserve warned the virus could potentially disrupt global markets, creating a “new risk” to global economic growth. Since China is the world’s second largest economy, the prospect also increases the possible negative impact on global financial markets.
Though malls within China have been closed for weeks in an effort to arrest the spread of the virus, retailers all over the world are also seeing the effects via a severe slowdown in Sino tourism. From luxury goods purveyors such as Canada Goose (NYSE:GOOS) and Burberry (OTC:BURBY), to sportswear giant Nike (NYSE:NKE) all are feeling the pinch as Chinese consumers remain in lockdown.
As well, the domestic workforce has been told to stay home. Automobile manufacturers such as Honda Motor (NYSE:HMC) and Toyota (NYSE:TM) have extended plant shutdowns in China as they wait for the virus to abate. Foxconn, a crucial supplier of iPhone (NASDAQ:AAPL) components was planning to reopen on Monday, but reports indicate local authorities have told the manufacturer not to restart work yet.
Dramatic Stop Sign
The S&P 500 and Dow both jumped at least 3% for the week, their best performances since June. The NASDAQ topped 4%—its biggest weekly advance since February 2018, when it gained 4.66%. But, as opposed to the indices' weekly achievements, Friday’s performance provided a dramatic stop sign.

It was, first, a selloff on the final day of the week. When this occurs, it signals a lack of confidence in an uncertain environment, since traders fear being unable to unwind positions amid increasing risk.
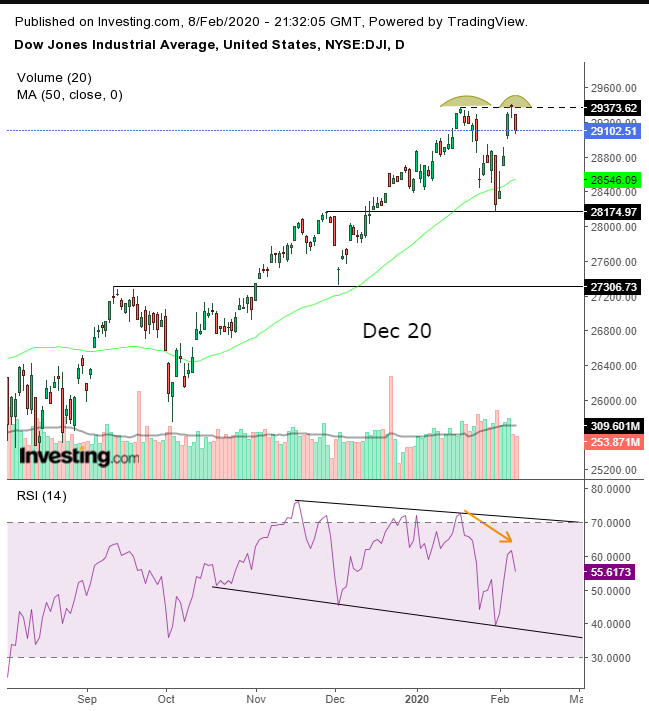
Second, the S&P 500 and Dow Jones each respectively completed an Evening Doji Star, a three-candle pattern that demonstrates a top. The location of the pattern, at the Jan. 17-highs, underscores the fact that there is a line of supply at this level. An RSI negative divergence—both since November and since the mid-January highs—adds to the bearish outlook.
Had volume spiked on Friday, the signal would have been even more potent. Still, the depth with which the price dug into Wednesday’s candle effectively demonstrates a bearish comeback. Third, the fact that the Evening Doji Star completed specifically on Friday makes the pattern even more meaningful.
Combining all this technical evidence, it appears we might be witnessing the making of a double-top with the 28,000 level—the November resistance turned support to the previous selloff that ended Jan. 31—as the neckline. Note, the elegant move on the chart as the previous, Dec. 3 low found support the same way, by the September highs.

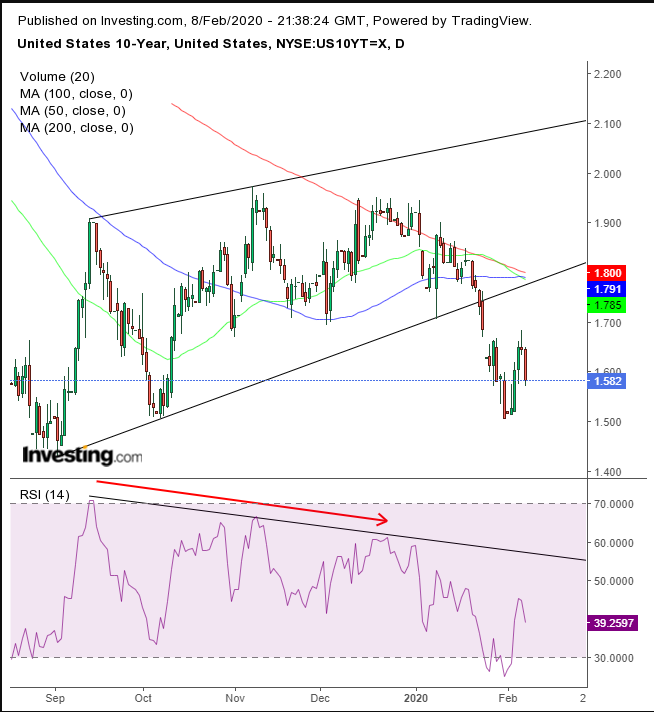
Yields on the U.S. 10-year Treasury fell back below 1.6 percent, after the RSI had been providing a negative divergence. On Friday, yields dropped after finding resistance by the previous support, from November through January. The 50 DMA fell below the 100 DMA, putting all three major averages in a bearish formation, with the longer MA higher than the shorter ones, demonstrating that the preceding prices were stronger.

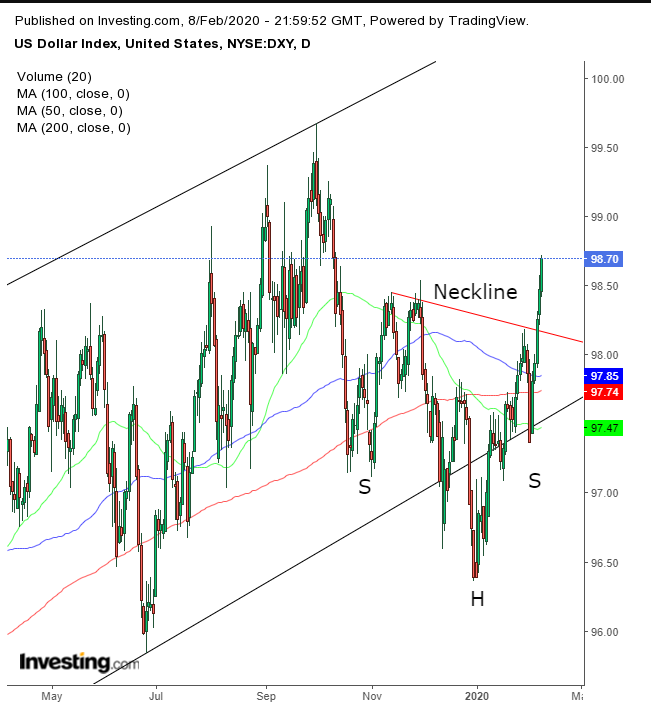
The Dollar Index climbed for the fifth straight session on Friday, extending an upside breakout to a H&S bottom, from the perspective of the Oct. 1 high, or a H&S continuation pattern within the context of the rally since the February 2018 bottom, above 88 and within the rising channel since August.
Still, the USD weakened versus the yen, amid the rush to safe havens.
Bitcoin extended a rally to a fourth straight session, surpassing the $10,000 mark, for the first time since Sept. 21.

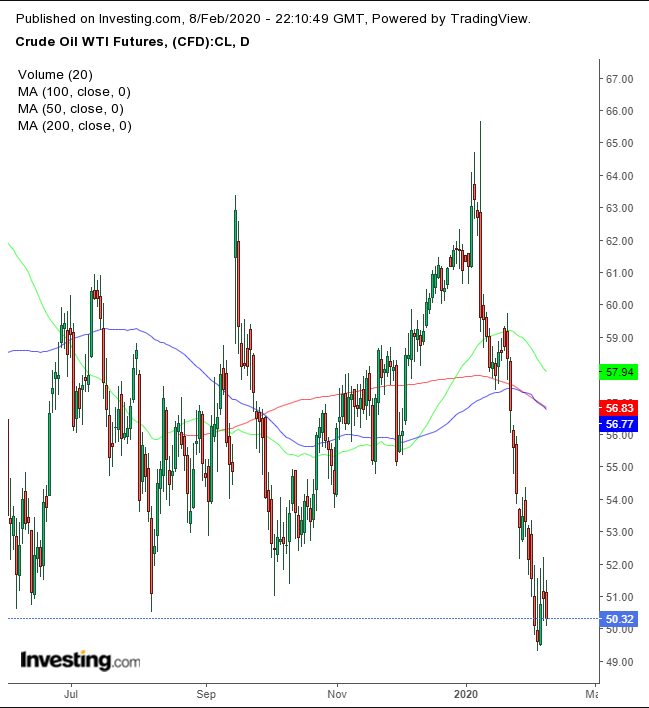
Oil slumped on the final day of trade last week, reversing toward the $50 level, back below the June-to-August-to-October lows. The commodity suffered the longest stretch of weekly declines since 2018 on the dismal outlook for demand as refineries in China are already processing 15% less crude since the epidemic began.
The forecast for crude prices remains bearish as OPEC continues to wait for Russia’s decision on proposed deepening of production cuts. However, if Libya should return to exporting oil it would more than offset any additional cuts, pressuring prices. However, talks in Geneva between the warring factions within Libya ended yesterday without a deal. The UN proposed another round of negotiations which would begin on Feb. 18.
The Week Ahead
All times listed are EST
Tuesday
4:30: UK – GDP: expected to remain flat at 0.4% QoQ and fall to 0.8 from 1.1 YoY.
4:30: UK – Manufacturing Production: seen to surge to 0.5% from -1.7%
9:00: Eurozone – ECB President Lagarde Speaks
10:00: U.S.– Fed Chair Powell Testifies: the head of the U.S. central bank will brief the Joint Economic Committee in Washington, DC.
20:00: New Zealand – RBNZ Interest Rate Decision: the central bank is anticipated to hold rates steady at 1.00%.
Wednesday
5:00: Eurozone – Industrial Production: expected to have dropped to -1.5% MoM from 0.2% the month previous.
10:30: U.S. – Crude Oil Inventories: analysts forecast a plunge to 2.831 million from 3.355 million barrels last week.
Thursday
8:30: U.S. – Core CPI: expected to edge up to 0.2% from 0.1% in December.
Friday
2:00: Germany – GDP: seen to remain flat at 0.1% QoQ, while plunging YoY from 1.0% to 0.2%.
8:30: U.S. – Core Retail Sales: likely dropped to 0.3% from 0.7%
8:30: U.S. – Retail Sales: expected to remain flat at 0.3% for the month of January.
