- All four major indices jumped on strong economic signals
- Historically low unemployment and lagging inflation: Goldilocks Economy or Low Participation Rate inflating headlines?
- Russell 2000 continues to outperform, positively correlated with USD
Recession worries eased on Friday after surprisingly strong nonfarm payroll gains and even lower unemployment boosted U.S. stocks on the final day of last week's trade. The S&P 500, Dow Jones Industrial Average, NASDAQ Composite and Russell 2000 all jumped after the unexpectedly robust release, which turned what had been a losing week into a second straight week of gains.
While both a low unemployment rate and wage growth signal an economy that can sustain growth without needing monetary tightening, concerns that a high employment rate could be due to a low participation rate are rising, and that lagging wage growth diminishes the sustainability of the strong labor market. Upcoming wage reports may provide a more solid clue regarding the trajectory for wage growth, and with it employment. As well, this upcoming week's equity market performance might more accurately indicate whether these record highs are sustainable.
Green Sectors, Paltry Gains
The S&P 500 jumped 0.96% on Friday, with every sector in the green. Industrials outperformed (+1.21%) while Utilities (+0.55%) lagged.
The benchmark’s advance was the highest in a month, though the week’s gains were a paltry 0.2%. The index was pressured by Energy (-2.97%) which tracked oil prices lower, posting a second weekly loss. On a weekly basis, Financials outperformed (+1.34%) even though bets had increased that languishing inflation could force the Fed to cut rates.
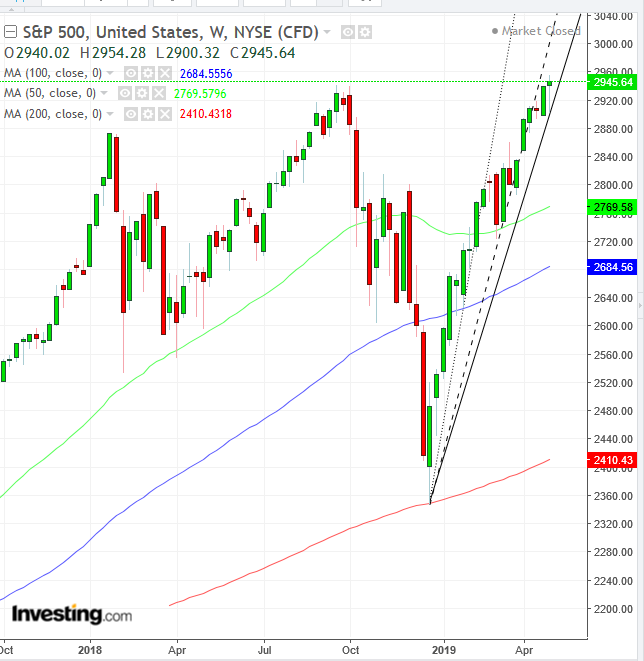
Chart powered by TradingView
After posting a new all-time high Wednesday, the SPX erased three-and-a-half days of gains, extending losses into Thursday for its lowest close in eight sessions. The trading pattern for the week developed an imperfect hanging man (with an upper shadow, diminishing the bull-trap characteristics of the pattern), complete with a following candle that closed below the hanging man’s body at 2,940.02. When that happens, the price might slip below the short-term uptrend line since the December bottom. That's already happened twice but who knows, the third time could be the 'charm.'
The Dow Jones Industrial Average underperformed peer indices on Friday. It gained 0.75%. This is surprising considering Industrials were the best performers on the SPX. Technically, the Dow is still below its short-term uptrend line since the December rout after falling below it on Apr. 25. The mega cap index was down 0.15% for the week.
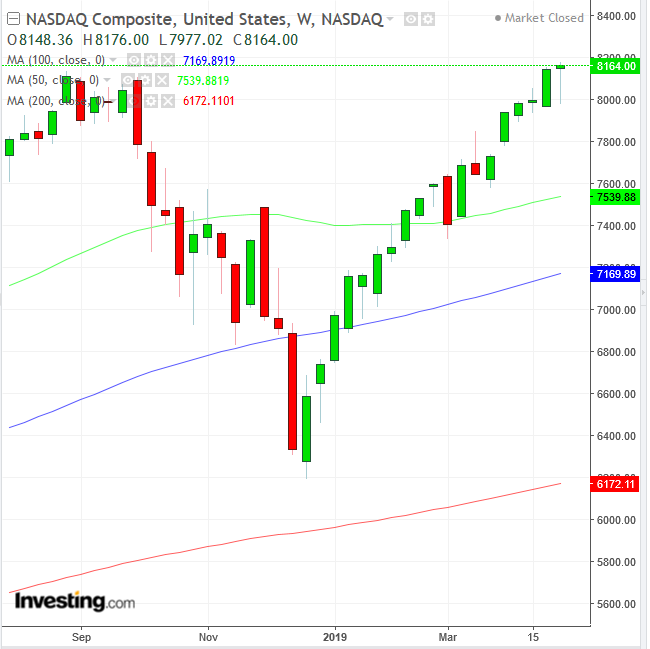
Chart powered by TradingView
The NASDAQ Composite jumped 1.58% on Friday to both a new all-time high as well as a fresh record close. The tech-heavy benchmark closed just .38 points below its highest trading price, demonstrating how tightly the bulls controlled the weekend close. For the week, the NASDAQ gained 0.22%, forming a powerful hanging man, with an exceptionally long lower shadow, a bearish omen, complete with a close below its 8,148.36 weekly opening price. The record high makes it only more susceptible to shorts.
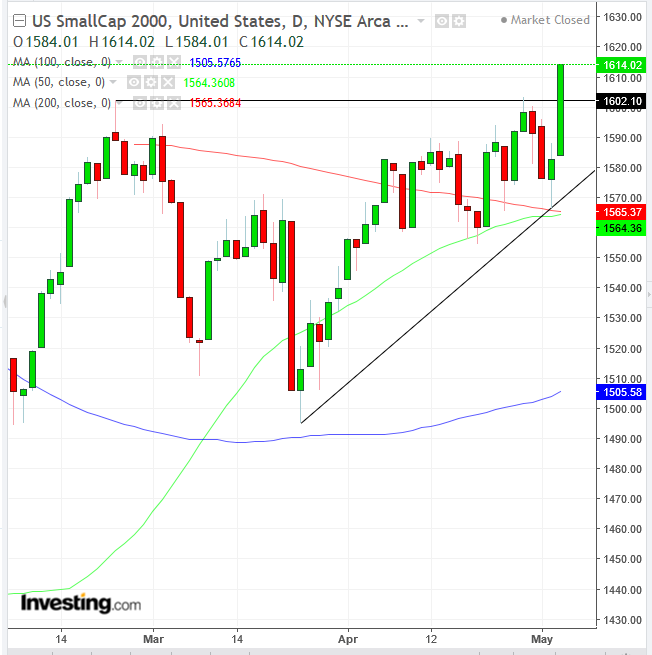
Chart powered by TradingView
The Russell 2000 outperformed on Friday, surging 2.14%. It scaled to its highest point since Oct. 1, breaking out of an ascending triangle, which was supported by the 100 DMA, as the 50 DMA approaches the 200 DMA, heading for a golden cross, if the breakout pattern follows through; It could also become resistance, if the 0.8% breakout proves a bull trap.
Small caps have been outperforming much of the time for a while now, and investors once again demonstrated confidence in their positions by locking in the week’s close at the index's highest point. For the week, the Russell added 1.39%, far outperforming on that scale too. It’s interesting to note that as of late April the dollar completed an ascending triangle, as well (which has been repeatedly tested). Perhaps the outlook for an increasingly strong dollar hurting overseas sales of mutlinational mega caps is also boosting domestic firms.
Stronger Employment, Weaker Wage Growth: Goldilocks Economy?
Friday's employment report showed that the unemployment rate unexpectedly fell to 3.6%, a new, 49-year low, though wages didn’t grow—something that could have been expected with the tighter jobs market. The average hourly pay rate increased by 6 cents, or .2% MoM, to $27.77 in April, coming in below the 0.3% expectation.
This pattern of stronger employment not followed by proportionate wage increases, which would put more money in the hands of consumers, thereby increasing demand for goods to drive prices higher, spurring inflation, has led some to designate this a Goldilocks Economy—it's running not too hot and not too cold, chugging along at a moderate speed. Some see this as the ideal situation, claiming it can stay for the long haul, rather than stall because it’s too slow, or burn-out because it’s overheating.
Still, some are leery of the participation rate, which fell to 62.8% from 63%, on concerns that the low unemployment rate is at least partly due to individuals simply giving up looking for work. It gets yet more complicated when one is asked to explain why wages aren't rising as expected if this is supposed to be an employee’s market.
If it’s because middle- and working-class employees are being left out of the economy, is it fair to make the case it's truly growing? Will the lowest unemployment rate since December 1969 be sustainable without this huge, integral chunk of the workforce? What happens when workers and labor unions decide to strike in order to coerce employers to raise wages?
Finally, perhaps the biggest question economists have been trying to answer for quite some time now is when and what would be the impact of exponential technological advancements on workers who are unable to adapt to the ever accelerating, changing labor landscape as computers and robotics take on a growing piece of the employment pie.
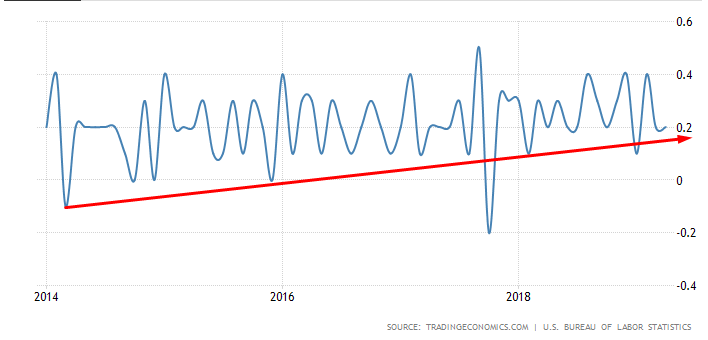
Average hourly earnings reached the bottom of an ascending channel, demonstrating the crossroads up ahead of workers. Will the price rebound toward the top of the channel at 0.4%, or might it fall for the second time since late 2017, to retest the -0.2% level, suggesting a recession?
Will the market’s weak internals: a low participation rate, amid falling yields and a strong dollar be proven to be leading indicators to a recession, or is there enough juice in the recent positive global economic rebound and positive earnings to kickstart the economy and pull wages along? The next wage data release would be one clue in this giant economic jigsaw puzzle. We'll have to wait to see if it falls below the channel or rebounds.
The Week Ahead
All times listed are EDT
Monday
U.K., South Korean and Japanese markets are on holiday.
13:45: Canada – BoC Gov Poloz Speaks.
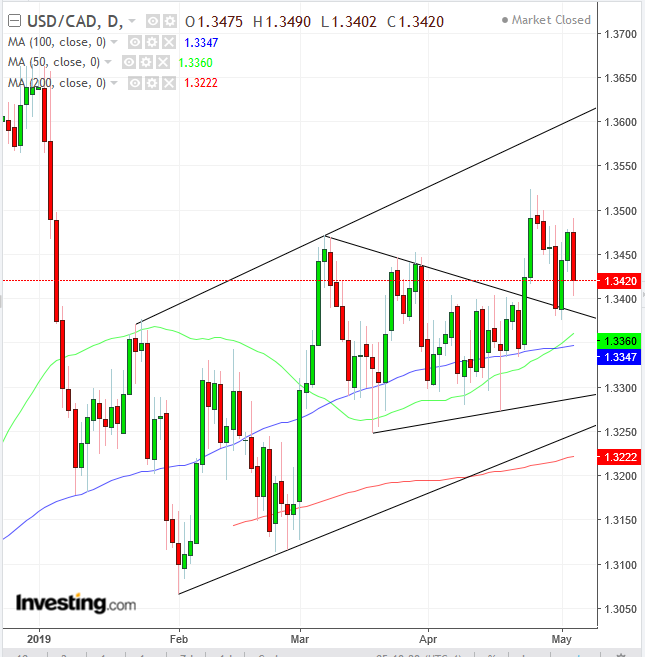
Chart powered by TradingView
The USD/CAD pair is retesting the top of a symmetrical triangle, for a second time, suggesting a continued rally within an ascending channel since the beginning of the year.
23:00: Australia – Retail Sales: expected to plunge to 0.2% from 0.8% MoM.
Tuesday
00:300: Australia – RBA Interest Rate Decision: expected to remain at 1.50%, followed by RBA Rate Statement.
10:00: U.S. – JOLTS Job Openings: seen to rise to 7.350 million from 7.087 million.
10:00: Canada – Ivey PMI – estimated to drop to 51.1 from 54.3.
22:00: New Zealand – RBNZ Interest Rate Decision: predicted to be cut to 1.50% from 1.75%, followed by Monetary Policy Statement and the central bank's Rate Statement.
Wednesday
7:30: Eurozone – ECB President Draghi Speaks, followed by publication of the ECB's Account of Monetary Policy Meeting.
10:30: U.S. – Crude Oil Inventories: previously at 9.934M.
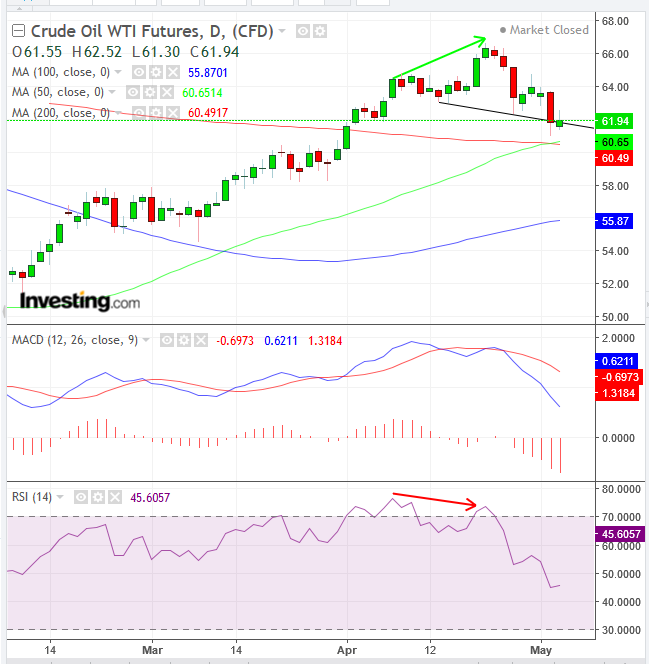
Chart powered by TradingView
Oil prices are hanging by a thread, at the neckline of a potential down-sloping H&S top, which occurs when demand is too weak to form a proper right shoulder that would sustain prices for a bit longer. On the other hand, the very recent golden cross is supporting the price, which might push it higher.
However, both the MACD and RSI suggest the odds are in favor of a decline. The latter is also providing a negative divergence to the recent price rally.
Thursday
8:30: U.S. – Fed Chair Powell Speaks.
8:30: U.S. – PPI: expected to plunge to 0.2% from 0.6% for the previous month.
Friday
4:30: U.K. – GDP: seen to leap to 0.5% from 0.2% QoQ, to 1.8% from 1.4% YoY, but to decline to 0.00% from 0.02% MoM.
4:30: U.K. – Manufacturing Production: probably slumped to 0.1% from 0.9%.
8:30: U.S. – Core CPI: estimated to have climbed to 0.2% from 0.1% MoM.
8:30: Canada – Employment Change: expected to have surged to 15.0k from -7.2k.
