- U.S. stocks show signs of weakness but mostly eke out gains to close the week
- Demand for Treasurys and gold shows that investors elected to believe foreign central bankers over the Fed
- Oil slumps on outlook for economic slowdown and rising U.S. production
U.S. stocks managed to mostly eke out gains on Friday, rebounding from losses earlier in the day and throughout the week. A rally in tech shares during the final minutes of the session boosted averages both for the day and the week.
The S&P 500 Index manage to squeeze out a meager 0.07% increase on the final day of last week's trade. The benchmark's initial weakness was triggered by the Australian Central Bank, the Reserve Bank of Australia (RBA), which announced it was lowering growth expectations from 3.25% to 2.75%.
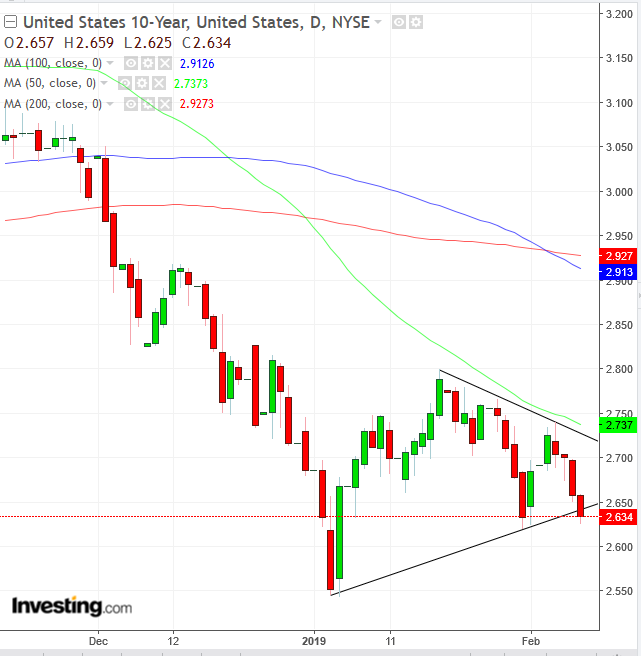
The yield on the U.S. 10-year Treasury note fell on Friday for the fourth straight day, the result of growing fears of an economic slowdown. Technically, the yield closed below a continuation pattern. It’s also the third straight week during which yields have been falling, as investors amass Treasury holdings, perhaps on fears that equities will be heading lower too.
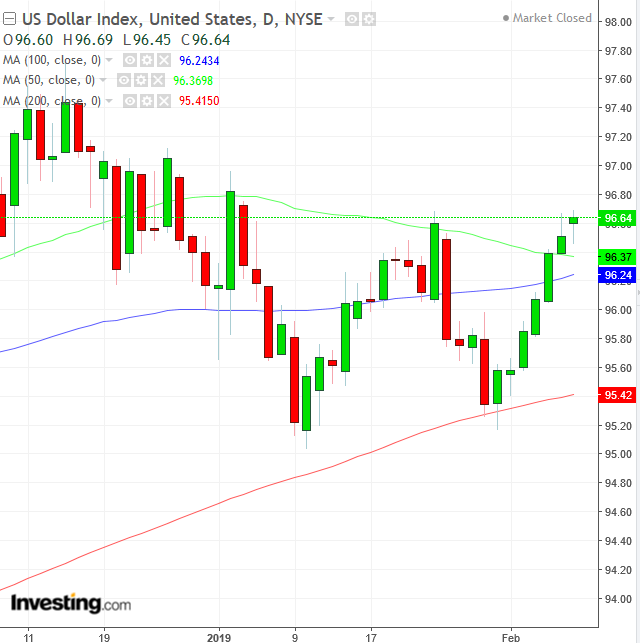
The dollar climbed for a seventh straight session—its longest rally since U.S. President Donald Trump won the election in 2016—to its highest level since Jan. 2. It was also the USD’s biggest weekly percentage gain in six months. Technically, the price, which found support off the 200 DMA from Jan. 31, for the second time, since Jan. 9, jumped back over the 100 and 50 DMAs during the week.
In case investors are confused as to why the dollar would have its longest winning streak since the Trump bump over two years ago, specifically after the Fed turned dovish, it's because markets don’t seem to be buying into Fed Chair Powell’s reassuring comments of a positive economic outlook. The sharp uptake of U.S. sovereign bonds, considered the world’s most secure and liquid, attract foreign investors, who buy the dollar in order to pay for the bonds. It could also signal that rather than heed the Fed, investors are finding foreign central banks more credible.
The RBA's reduced GDP forecast for the 12 months to June 30 was accompanied by it similarly slashing its inflation forecast for the same period from 2 to 1.25 per cent. As well, its annual GDP and inflation forecasts for the year to June 2020 were cut from 3.25 and 2.25 per cent to 2.75 and 2 per cent respectively.
Better-Than-Expected Earnings Provide Friday's Boost
From a sector perspective, Communication Services (+0.58%) and Technology (+0.58%) saved the SPX from its worst weekly drop since the pre-Christmas rout, spurred by better-than-expected earnings. It’s noteworthy that defensive sectors Consumer Staples (+0.47%) and Utilities (+0.43%) were not far behind.
Financials (-0.50%t) underperformed, in tandem with the dimming prospects of further rate hikes, Australia’s warning reinforcing the Fed's recent perceived dovishness. Energy shares (-0.46%) tracked slumping oil prices back below $53.
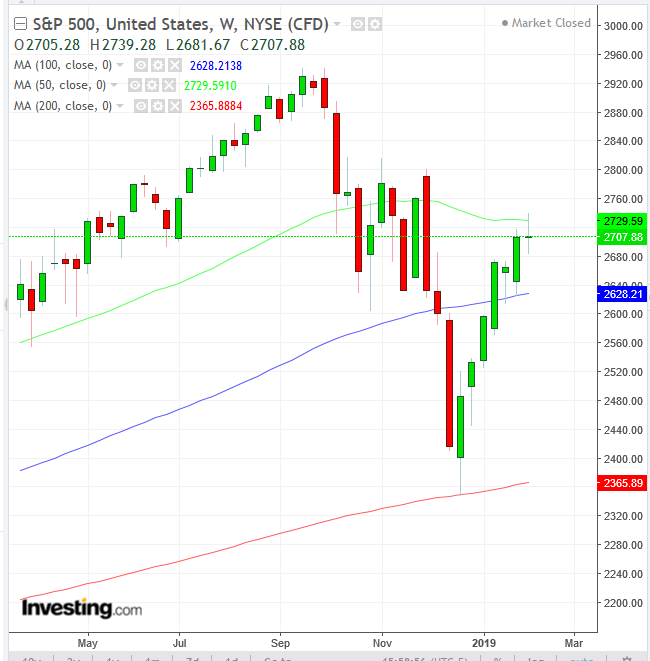
Technically, the S&P closed back above the 100 DMA, following its Wednesday selloff, after the benchmark bumped its head against the bottom of the 200 DMA on Tuesday.
On a weekly basis the index fared a bit worse than its Friday performance, gaining just 0.05%. Defensive Utilities (+2.07%) led the pack.
However, cyclical Technology shares (+1.98%) were right behind, thanks to Friday’s earnings beats for sector stocks including Expedia (NASDAQ:EXPE) and networking equipment maker Ubiquiti Networks (NASDAQ:UBNT), which helped to avoid a nearly flat week. Energy (-3.01%) fell the most since December on a weekly basis, mirroring WTI’s fortunes for the same period.
Technically, the S&P's paltry weekly advance, which whipsawed about 1.8% between an approximate 1.2% gain and a 0.75% loss on Friday, developed a high wave candlestick, after it found resistance at the 50-week MA. The candlestick’s wild swings with no meaningful change in the closing price suggests that investors are more than just confused, they lacked guidance as to leadership. Therefore, the candle connotes the potential for a change in course for the market.
The Dow Jones Industrial Average dropped 0.25% for a third straight day for an accumulated 1.2% loss, as a global trade resolution appears to be elusive, weighing on the mega cap index whose listed companies rely on foreign markets to support the robust growth shareholders have come to expect. Technically, the 30-component index closed off the lows of the day on Friday, finding support by a convergence of the 100 and 200 DMAs, as well as the downtrend line since Oct. 3, after scaling above it on Monday. On a weekly basis, the Dow climbed 0.17%, posting its seventh straight weekly advance, its longest since the 8 straight weekly advance that ended during Nov. 2017.
The tech-heavy NASDAQ Composite advanced 0.14% on Friday, making it the day's outperformer. Technically, the index found support for the second straight day at the 100 DMA, after, like the S&P, falling since Wednesday and nearing the 200 DMA from below. On a weekly basis, the NASDAQ gained 0.47%, for its seventh straight weekly increase, an accumulated 15.24% advance. Technically, the benchmark touched the 50-week MA and dropped, giving up a 2.02% advance.
The Russell 2000 eked out a 0.06% gain on Friday, which failed to rebound back above the 100 DMA. On a weekly basis, the small cap index advanced 0.29% for its seventh straight weekly gain, with a total advance of 16.82%. Once again the Russell proves that its small cap stocks can outperform larger cap peers. It has provided the best results post-Christmas, even as the financial media broadcast optimistic headlines on U.S.-Sino trade talks. Technically, the price attempted, but failed, to overcome the 100-week MA.
Friday's price action provides a classic example how in the markets, “it ain’t over till it’s over,” as stocks rebounded during the week’s final minutes of trading.
Slowing Growth, Trade Worries Will Continue to Weigh on Markets
The primary reason Australia’s economy had such a profound impact on U.S. equities is that it underscored the writing already on the wall, which has been previously emphasized by European and British economic policy officials, who have all already lowered their growth outlooks. Last month the European Central Bank (ECB) said risks to the eurozone’s economic outlook had shifted to the downside, while the European Commission this week slashed its outlook for growth across the region.
On Thursday, the Bank of England forecast 2019 U.K. gross domestic product would grow at the slowest pace since 2009. Friday's RBA release deepened the negative prognosis for global growth now being delivered by global central banks.
As if these dimming growth prospects weren’t enough, the U.S.-China trade front added additional pressure to the situation. On Friday, speaking at an event in Michigan, Cui Tiankai, China’s ambassador to the U.S. said the competition between the two countries shouldn't be considered a "zero-sum" game, in which the "winner-takes-all," but rather should focus on cooperation, so that the results will be "win-win."
Dan Clifton, head of policy research at Strategas forecasts that even if the U.S. and China do reach some sort of resolution, that won’t be the end of the trade war threat. He believes President Donald Trump will likely hit European autos with a 25% tariff.
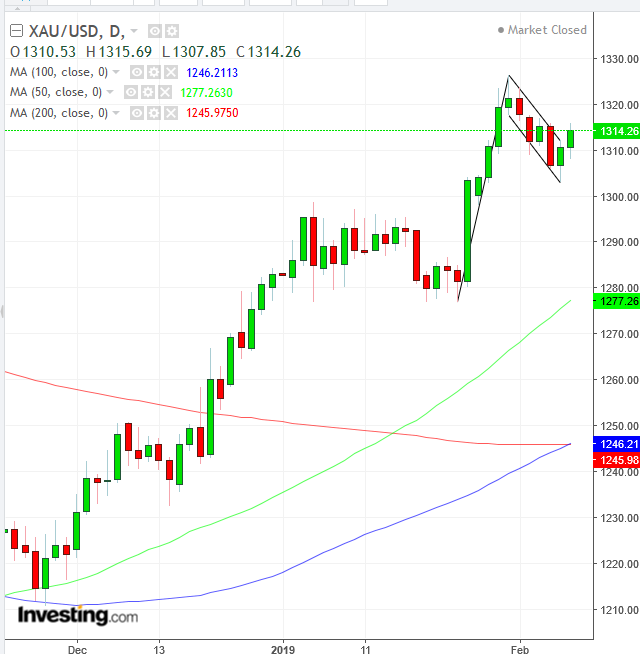
Supporting our argument that dollar strength does not project an outlook for U.S. economic growth right now, gold has been finding support at the $1,300 level during four of the last seven sessions. This occurred at the same time that the dollar rose, including the last two sessions.
Why would gold climb, even as the dollar strengthens? The two normally trade inversely. The dollar tends to gain when investors are willing to assume risk, meaning they clearly have have faith in further economic expansion.
Conversely, gold is buoyed when investors seek to preserve capital, when they become risk averse because the outlook for growth becomes gloomy. We'd argue, therefore, that gold’s rise ascent follows the same path as Treasurys, which boost the dollar when investors are in search of safe havens.
Furthermore, technically, gold is gearing up to continue climbing. The yellow metal may have completed a falling flag, bullish in an uptrend, and the 100 DMA is about to cross above the 200 DMA, after the 50 DMA already did so last month, triggering a Golden Cross.
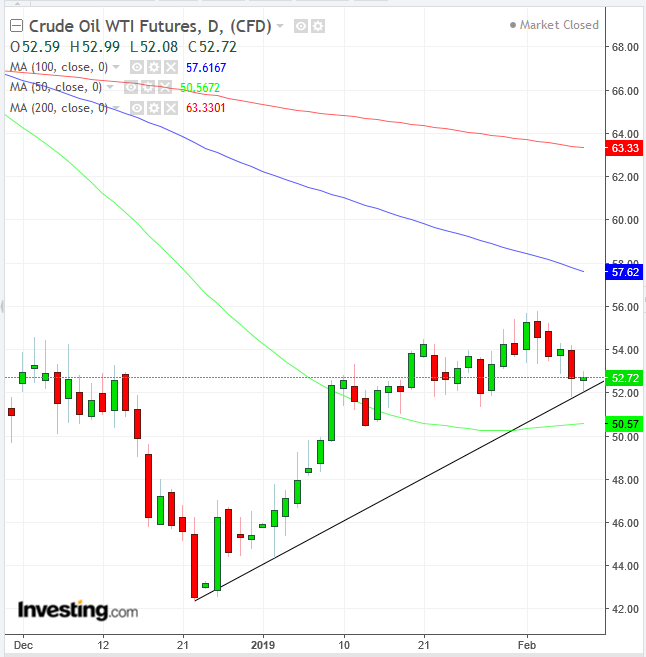
Oil’s rise and fall has echoed the outlook for global economic expansion. As such, its current slump is another nail in the coffin for the longest equities bull market on record.
The negative press the U.S-Sino negotiations continue to garner exacerbates the outlook for a slowdown. In addition, the number of active oil rigs in the U.S. increased to 854, another headwind for slumping oil prices. Finally, the longest dollar rally since Nov. 2016 further pressures the commodity. Technically, the price is retesting the uptrend line since the post-Christmas risk-on rally, which the 50 DMA protects from below, above the $50.50 level.
The Week Ahead
All times listed are EST
Monday
4:30: U.K. – Trade Balance (December), Industrial and Manufacturing Production (December), GDP (December): non-EU trade deficit to narrow to £3.70 billion, while GDP to growth 0.3% MoM, and at a three-month average of 0.3%. Q4 preliminary GDP reading to grow 0.3% QoQ and 1.4% YoY.
19:30: Australia – NAB Business Confidence (January): index to remain flat at 3.
Tuesday
18:30: Australia – Westpac Consumer Confidence (February): index to fall to 99.2 from 99.6.
Wednesday
4:30: U.K. – CPI (January): to rise 1.9% YoY from 2.1%, and core CPI to remain flat at 1.9% YoY.
8:30: U.S. – CPI (January): CPI to rise 1.5% YoY and gain 0.1% MoM, and core CPI to rise 2.1% YoY from 2.2%.
10:30: U.S. – EIA Crude Inventories (w/e 8 February): stockpiles rose by 1.263 million a week earlier
18:50: Japan – GDP (Q4, preliminary): growth forecast to be 0.4% QoQ and 1.4% YoY.
Thursday
2:00: Germany – GDP (Q4, flash): growth expected to be 0.1% QoQ and 0.9% YoY.
5:00: Eurozone – GDP (Q4, preliminary): QoQ rate expected to come in at 0.2% and YoY 1.2%, from 0.2% and 1.2% respectively.
8:30: U.S. – Retail Sales (December): expected to rise 0.1% from 0.2% MoM.
20:00 (Tentative): China – Trade Balance (January): exports expected to have fallen in Jan. to $33.50 billion from $57.06 billion.
20:30: China – CPI (January): prices to rise 2% YoY.
Evening – U.K. Parliament to vote on Brexit deal
Friday
4:30: U.K. – Retail Sales (January): expected to rise 0.2% MoM from a negative 0.9% .
8:30: U.S. – NY Empire State Manufacturing Index (February): index to rise to 7.6 from 3.9.
10:00: U.S. – Michigan Consumer Sentiment (February, preliminary): confidence to rise, with the index going to 94.0 from 91.2.
