News headlines trumpet that the post-Christmas equity rally is stalling. It is. But how much of it is self-perpetuated?
Similarly, how would retail investors react when all the financial media warn that the biggest stock rally in a long time is losing steam?
We've been bearish on equities for months. While the current rally went higher than comfortable levels—in terms of our outlook—we maintain our position, which is based on our belief that the market has overstated the Fed's dovish tilt, and even possibly misinterpreted Fed Chair Jerome Powell's comments as a policy shift. Rather, we see this more as a pause on policy decisions due to the lack of data caused by the government shutdown.
However, due to the murky picture in stocks, we suggest looking at another asset in attempt to gain a fresh perspective.

Treasury yields typically maintain a negative correlation with equities. While stocks rise when investors seek to increase risk, they rotate capital out of shares into Treasuries when they're searching for safety.
Yields maintain an inverse relationship with prices. Increasing Treasury demand raises prices, reducing the bond’s payout, or yield. Conversely, falling demand—or rising supply—reduces Treasury prices, increasing what’s left between the price and the bond’s payout, hence the yield rises.
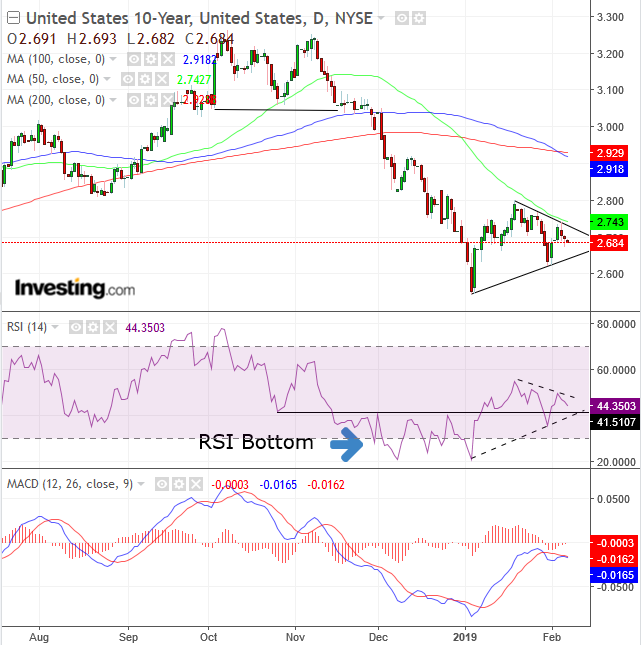
In the chart, of the 10-year note, it's clear that yields have been falling since they topped out from October through December, in positive correlation with U.S. equities, due to recession fears. Note, that the robust stock rally that followed the worst December ever pushed yields from 2.5 to 2.8, not exactly trend-changing.
So why have yields not jumped, as investors dump Treasurys on their rotation back into risk? Remember the thin volume we've been pointing out throughout the rally? That’s because there has not been broad participation in the current equity rally. Investors remained bond-heavy.
The yield on 10-year Treasurys have been trading within a triangle formation since the beginning of 2019. While the pattern suggests equal weight between supply and demand in the short-term, it does not alter the medium-term trend, which has been down since December. Should yields break the triangle to the downside, it would signal continuous demand for Treasurys, which in turn would imply that investors have lost their appetite for risk, as well as indicate a resumption of the trend of investors’ rotating out of risk and into safety.
Note, both the RSI and MACD have fallen to the most oversold levels since early 2016. Both have since climbed, suggesting a potential reversal for yields, but as we just pointed out, that hasn't happened. Rather, the RSI, after bottoming, has been forming the same triangular consolidation as yields. The MACD spluttered after bouncing back to the zero line. Both indicators demonstrate that they are squeezed between two opposing narratives.
Which will win? We’re betting on a downside breakout of the triangle, a continuation pattern, as the 50 DMA framed the resistance of the triangle top and the 100 DMA fell below the 200 DMA, testifying to a general price breakdown.
If that happens, it’s a safe bet that equities will fall too.
