- Earnings results plus guidance renews hopes on growth, offsetting some of IMF’s outlook-cut
- Dow, NASDAQ, Russell all gain for fifth straight week
- Oil remains flat, caught between conflicting forces
Though major U.S. equity indices, including the S&P 500, Dow and NASDAQ Composite, all closed higher on Friday, boosted by President Donald Trump agreeing to end the partial government shutdown that had been in affect for 35 days, weekly market performance painted a much more nuanced—and mixed—picture. It appears corporate results may actually be buoying shares during this earnings season, though we maintain it's the better forward guidance that's doing the heavy lifting after last quarter's dismal forecasts.
Still, even if it’s understandable and healthy for investors to take a breather in the wake of the equity market's bullish performance since Christmas, that doesn’t explain the repeated breakdown in market structure, displayed by the total lack of coherence between defensive and cyclical stocks. As such we view these retreats as signaling a lack of leadership rather than an orderly correction.
Stronger Corporate Guidance Boosts Stocks
Without doubt, however, the bright spot on Friday was the president agreeing to open the government for three weeks as Congress continues to negotiate for border wall funds. It was a dramatic turnaround after five weeks of political infighting while furloughed government employees remained unpaid.
Nonetheless, we're convinced the longer-term market driver will continue to be corporate guidance. Procter & Gamble (NYSE:PG) provides a case in point. Despite releasing modestly stronger-than-expected earnings when it reported Q2 2019 results on Wednesday, January 23, its stock climbed 4.87 percent as the firm raised its full-year sales guidance.
This becomes more significant when recalling that the IMF reduced its global growth outlook for the next two years, citing the trade war as the central culprit for its assessment. As well, recent numbers out of China, and declining PMIs in Europe and Japan support that perspective.
Risk-On Returns
U.S. equities advanced for a second day on Friday, as positive earnings reports spurred risk-on appetite. Treasuries dropped, and the dollar plunged.
The S&P 500 Index opened the final day of trade last week 0.57 percent higher, extending the day's gains as much as 1.14 percent, before trimming that to +0.85 percent at the close. Materials outperformed (+1.9 percent) and Industrials rose (+1.27 percent) on speculation the arrival of a Chinese delegation in Washington this coming week may help pave the way for a trade deal.
Adding to overall optimism were reports that the Federal Reserve is weighing an end to reducing its balance sheet sooner than previously expected, a move that could ease regulatory measures of financial conditions. However, persistent quantitative easing weighed on Financial shares (+0.81 percent), resulting in mediocre returns. Defensive sectors Utilities (-1.37 percent) and Consumer Staples (-0.4 percent) were the laggards during Friday’s risk-on day.
However, on a weekly basis, the SPX's performance was much choppier. Thursday, for example, trade was weak at the open, with stocks languishing till the final hour. At that point, volume rebounded as did prices. The previous day, Wednesday, was particularly volatile, with prices both falling and rising about 0.75 percent, to ultimately eke out gains of just 0.22 percent at the end of the day.
All told, the SPX dropped 0.22 percent for the week, the first weekly loss for the benchmark index in 2019, ending a four-week winning streak. Real Estate shares outperformed (+1.44 percent), as FINRA released data showing that shorts for the XLRE index decreased to 2.48 million shares from 2.97 million shares, down 16.56 percent. We assume that the Fed's recent dovish shift may be at the heart of a change in outlook for property investments; the post-Christmas rally did the rest.
At the opposite end of the spectrum, Energy shares languished (-1.43 percent) amid a volatile week for oil prices.
The more telling aspect, however, is that it was another week in which market structure broke down, with no apparent leadership path, providing an incoherent message to investors.

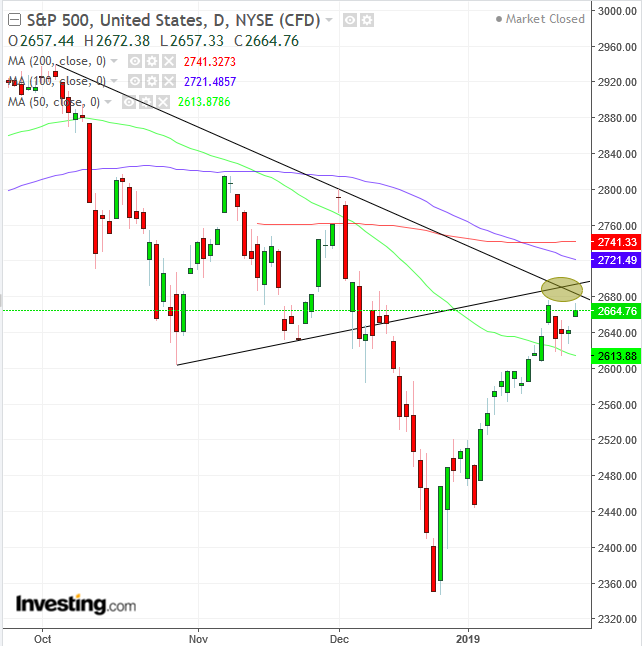
Technically, the S&P 500 finished the week in the same place it ended last week, under the resistance we forecast before the post-Christmas rally, coupled with a prediction of another rally. The resistance is formed by the downtrend line since the benchmark SPX's record-peak in September, the consolidation between the September peak and the December selloff as well as the major MAs, after triggering a Death Cross during the December rout.
The mega cap Dow Jones Industrial Average advanced 0.75 percent on Friday, to turn around a week of losses, eking out a 0.09 percent boost which extended its rally for a fifth week. Technically, Friday's price action gave up much higher profits, as much as 1.24 percent. The retreat formed a shooting star.
The NASDAQ Composite jumped 1.29 percent Friday and 0.11 percent for the week, following the same pattern as the mega-cap index, rallying for a fifth-week as well.
However, small caps' activity remains a mystery. The Russell 2000 outperformed the peer U.S. averages, leaping 1.3 percent, even amid the outlook for a resolution of the trade spat. We would expect small caps to fall in such an environment, as traders rotate out of domestic companies to large caps which would be able to continue raking in monster profits internationally once tariffs are eased. The fact that the Russell 2000 has outperformed repeatedly since the current round of trade talks puzzles us.
Perhaps the market message is that it does not believe there will be a breakthrough on U.S.-Sino trade relations. Could it be the trade tit-for-tat really isn’t a headwind as the market narrative has been indicating?

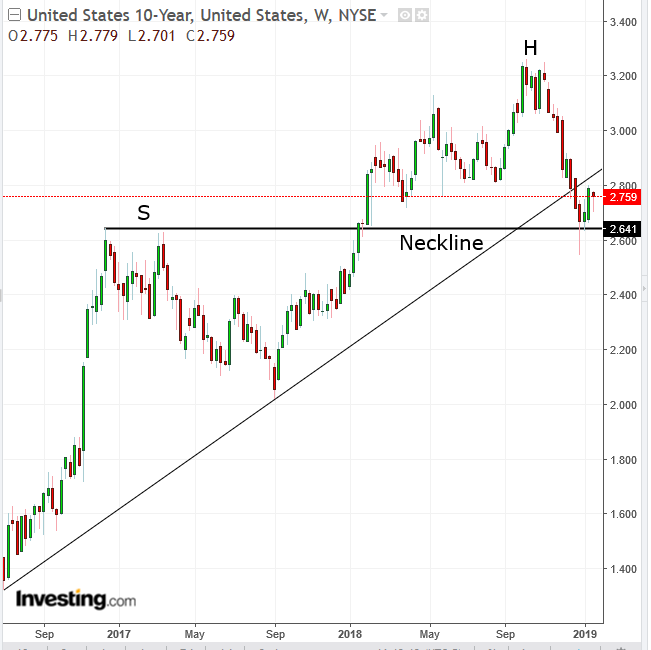
Though yields jumped on Friday as risk appetite returned, they fell on a weekly basis. What's noteworthy is the technical location of the 10-year during this weekly decline.
While the rate seems to have found resistance at the uptrend line since July 2016, after falling below it, it found support above the highs of late 2016 and early 2017. This technical conflict may very well echo the similar tug of war taking place with the outlook for growth, which includes a multitude of factors—the path to higher interest rates, normalizing the balance sheet, the U.S-China trade dispute, global growth or lack thereof (notably from China), Brexit, Trump's political stability, the dollar and oil.
In our view, the technical analysis shows that while the peak-trough series remains intact, the fall below its uptrend line is a red flag. This may be the first sign of a massive H&S top reversal since December 2016, where the left shoulder begins to form. Falling yields will occur if demand for Treasurys increases, generally a telltale sign of a bear market.

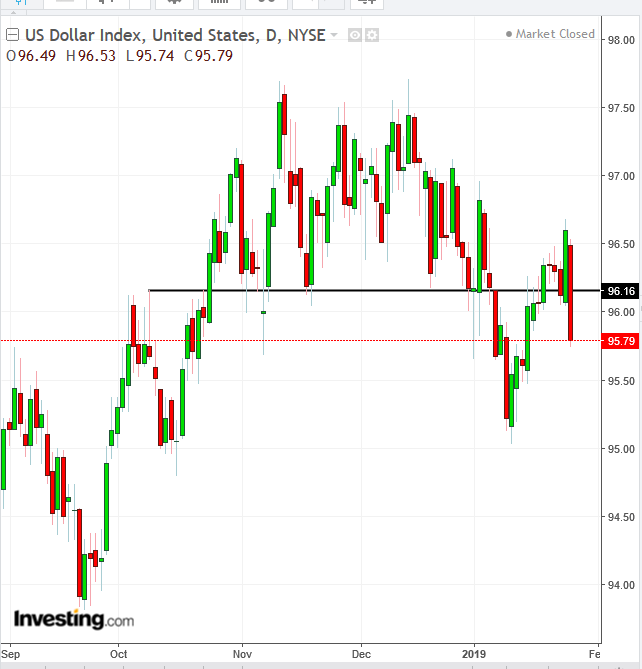
The dollar plunged on Friday as Treasurys were sold off, suggesting off-shore investors repatriated capital to get back into risk assets. Technically, the price fell back below the neckline, reinforcing the outlook of a top.

Oil closed flat after a volatile week. The price retraced 0.2 percent, ending three straight weeks of gains, similar to stocks.
Crude slumped on renewed fears of a slowdown after the IMF cut its forecast. The API's weekly oil inventories report, released Wednesday, rose by 6.55 million barrels last week, which hit oil prices when they were already down. The OPEC+ production cut agreement provided oil prices with support, which were further boosted by concerns about political events in Libya and Venezuela, a downtrend in U.S. drilling and sanctions against Iran.
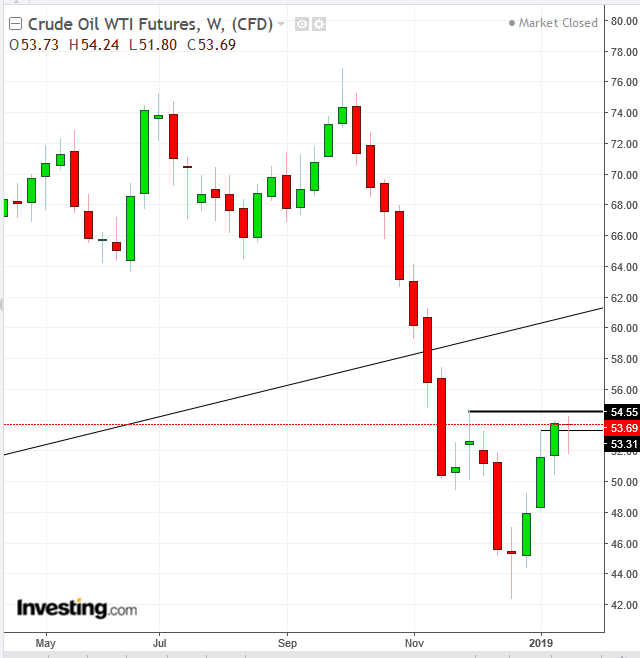
Technically, an advance for three straight weeks is very bullish, forming a Three White Soldiers pattern. The commodity's price needs all the bullish trends it can muster as it's failing to surpass levels for a second week.
In addition, after the December rout, the recent rally has still kept prices flat. As well, the November slide below the long-term uptrend line since the February 2016 bottom called into question oil's ability to maintain the rising peak-trough sequence. If prices fail to post a trough above $54.55 but fall below $42, we may be looking at a long-term downtrend.
Week Ahead
All times listed are EST
Monday
8:30: U.S. – Chicago Fed National Activity Index (Dec.): the previous read was 0.22
19:30: Australia – NAB Business Confidence (Dec.): index expected to fall to 2 from 3
Tuesday
14:00: UK (Tentative) – Parliament votes again on Brexit deal
Wednesday
00:00: Japan – Household Confidence (January): 42.5 expected; previous read was 42.7
2:00: Germany – GfK Consumer Confidence (February): forecast to fall to 10.3 from 10.4
5:00: Eurozone – Business Climate (January): expected to drop to 0.73 from 0.82
8:00: Germany – CPI (January, Preliminary): expected to fall to 1.6 percent from the previous reading which saw a rise of 1.7 percent
8:15: U.S. – ADP Employment Report (January): 170K jobs expected to have been created, from 271K a month earlier
10:00: U.S. – Pending Home Sales (December): expected to jump to 1.1 percent from -0.7 percent
10:30: U.S. – EIA Crude Inventories (w/e 25 January): previous reading saw a rise of 8 million barrels
14:00: U.S. – FOMC Meeting: no change in rates expected, but watch for any comments on the current situation and policy path, after the slower route to shrinking the balance sheet, which followed the Fed's dovish about-face
20:00: China – Manufacturing and Non-Manufacturing PMI (January): manufacturing PMI to fall to 49.3, from 49.4; non-manufacturing PMI expected to rise to 53.9 from 53.8 previously
Thursday
3:55: Germany – Unemployment Rate (January): rate to hold at 5 percent
5:00: Eurozone – GDP (Q4, flash): QoQ rate to remain steady at 0.2 percent, while YoY figure to decrease to 1.2 percent from 1.6 percent
8:30: U.S. – Initial Jobless Claims (w/e 26 January): expected to rise to 201K; previous week saw claims fall to a fifty year low of 199,000, with a 4-week average of 215,000
9:45: U.S. – Chicago PMI (January): expected to drop to 61.0 from 65.4
20:45: China – Caixin Manufacturing PMI (January): forecast to remain flat at 49.7
Friday
4:30: UK – Manufacturing PMI (January): forecast to rise to 53.5 from the previous reading of 54.2
5:00: Eurozone – CPI (January, flash): the pace of price growth probably slowed to 1.4 percent from the 1.6 percent rise in December
8:30: U.S. – Nonfarm Payrolls (January): 165K jobs expected to have been created, from 312K, while average hourly earnings to rise 0.3 percent, from December’s 0.4 percent growth MoM
10:00: U.S. – ISM Manufacturing PMI (January: indices to fall to 54.1 from an upward 54.3 revision
