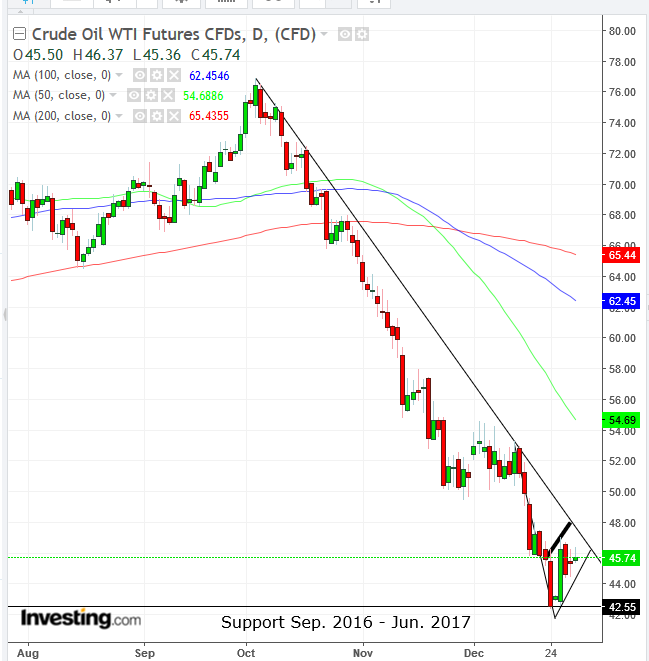
Between early October and last week, oil lost nearly half its value. Gains that took 16 months to accumulate were wiped out in 12 weeks.
The commodity's collapse was the result of a number of factors including expanding US production at the same time that the outlook for global economic growth was contracting, and with it slowing energy demand from businesses and for infrastructure investments.
At first, only oil was sold off. But crude's rout pressured the rest of the market, leading to a seesawing relationship, fraught with volatility. Over the past few months, we've made a series of bearish calls on oil. Not everyone has agreed, but we refer skeptics to the 2014-2015 crash which took oil from just under $108 to $26, a near 76% liquidation.
We're about to make yet another bearish call.

The price of oil has been forming a rising flag, bearish in an uptrend. It’s noteworthy that the flag began upon reaching the mid $42 level, an area of support between September 2016 and June 2017.
That fits nicely within the dynamic of the pattern, in which traders are fearful the market has gone too far; they cash out and take a breather while waiting for further evidence of the trend. The downside breakout is the signal for a resumption of the trend prior to the interruption, in the shape of a flag.
Since the prior trend is expected to continue, the recent, sharp move, is measured for the next move, as it is expected to repeat itself. From the $53.27 high price on December 13 to the $42.36 low, posted December 24, is $10.91. That's the expected move from the break-point of the pattern bottom, upon a downside breakout.
Trading Strategies
Conservative traders would wait for a close below the $42 level, to ensure that supply overcame demand at a price level that might attract buying. Then, they’d wait for a pullback to prove the old support had turned to resistance, with at least one long, red candle engulfing a green or small candle of either color.
Trade Sample
- Entry: $45
- Stop-loss: $46
- Risk: $1
- Target: $42
- Reward: $3
- Risk-Reward Ratio: 1:3
Moderate traders would wait for the break of $42 support, then wait for a return move for a better entry, but not necessarily for proof of the newfound resistance providing a better entry. This would increase the potential return against a higher risk.
Trade Sample
- Entry: $44
- Stop-Loss $46
- Risk: $2
- Target: $38
- Reward: $6
- Risk-Reward Ratio: 1:3
Aggressive traders may short with a decisive downside breakout, with a close at least below the $45 level. Then, they might wait for a rally for a better entry.
Trade Sample
- Entry: $45
- Stop-loss: $46
- Risk: $1
- Target: $42
- Reward: $3
- Risk-Reward Ratio: 1:3
