- Earnings set for fastest growth in 8 years
- Indices finish week higher despite Friday's declines
- Apple shares (NASDAQ:AAPL) plunge the most in four years despite stellar earnings, underscoring how demanding investors have become
Though stocks on the S&P 500, Composite and Dow Jones Industrial Average finished lower on Friday, and the small cap Russell 2000 eked out just a slight gain, all major US indices were higher for the week. The weekly finish signals that traders have recovered their confidence amid positive earnings and hopes for easing trade tensions.
As well, Friday’s US jobs report eviscerated any expectation of an economic slowdown, suggesting continued strong consumer spending instead, the backbone of the US GDP. Adding to the optimism, corporate results, of which roughly 75 percent have been reported so far, are set to collectively post the fastest growth in eight years.
That provides a positive double catalyst for equities at this point: additional corporate growth combined with the recent decline in stock prices has led to lower valuations, making equities more tempting, albeit driving volatility.
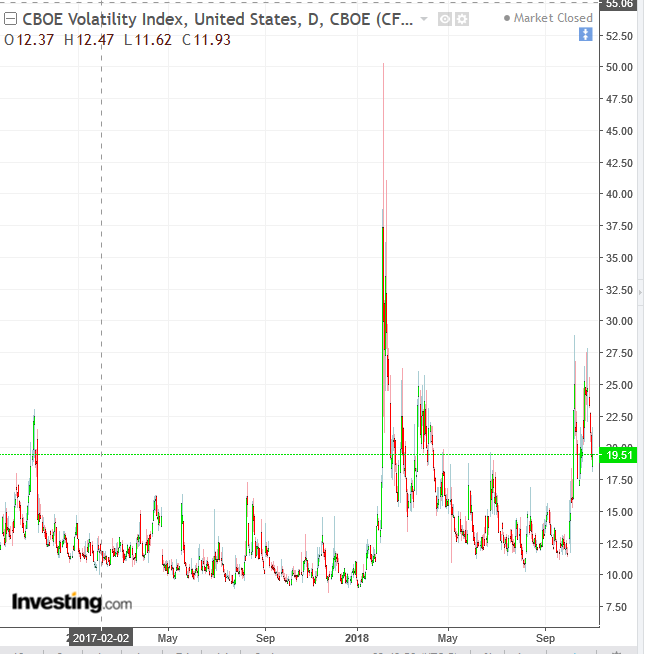
Even after the recovery in equity markets, traders are continuing to bet that volatility will be higher going forward than it was during all of 2017 as well as during the April to October period this year.
Best Week For S&P 500 In Months
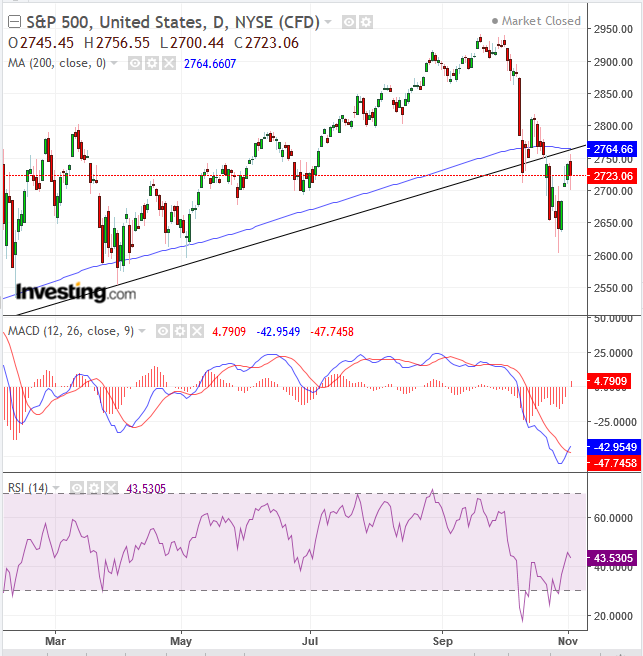
The S&P 500 finished Friday down 0.63 percent, with all sectors but Consumer Discretionary (+0.41 percent) in the red. Technology (-1.95 percent) and Communication Services (-1.01) led the declines, pressured heavily by one if its major components, Apple (AAPL), which plunged on Friday, down 6.63 percent on the back of its disappointing forward guidance.
Even after the US benchmark's first slide in four days, it was still its best week for the index in six months. The SPX advanced 2.42 percent, with ten sectors in the green while Utilities (-0.41 percent) lagged. Materials (+6.1 percent) was in a clear leader, calling into question the recent investor narrative that the US-Sino trade disputed would have lasting impact on markets.
In a glass-half-empty / half-full picture, the index trimmed about half of Friday's losses after US President Donald Trump said he thinks he will reach a trade deal with his Chinese counterpart. The initial losses, as much as 1.5 percent, were provoked by the president's economic adviser Larry Kudlow, who said the cabinet had not been asked to prepare for a trade agreement and that there was no serious movement to deal with the issue. Technically, Friday’s decline confirmed a dual resistance of the broken uptrend line since the February 2016 bottom and the 200 DMA, while the RSI and MACD turned into buy signals.
The Dow slumped Friday 0.63 percent but gained 2.36 percent for the week. Technically, the index found support by the uptrend line since the February 2016 correction low and scaled back above the 200 DMA, rendering the 30 component mega cap index's performance superior to that of the S&P 500. Both the RSI and MACD reversed into buy signals.
The NASDAQ Composite gave up 1.04 percent on the final trading day of the week, making it the underperformer, dragged down by Apple. The world’s biggest company by market cap beat on both revenue and EPS, up 20 percent and 41 percent, respectively. However, Services Revenue—a crucial metric for the mobile communication and computer giant as tech product companies make the transition to services providers for their devices—hit the $10 billion mark, a new all-time high.
Still, the stock plunged, falling to $207.48 per share, its biggest single-day drop in over four years, on softer guidance and a change in its sales disclosures starting next year. The company warned that a stronger dollar is likely to have a $2 billion impact on the December quarter's revenue and deliver a 2 percent hit to revenue growth.
For a number of years, Apple has been attempting to manipulate analyst perceptions of its growth, by refusing to disclose certain metrics. Going forward, Apple will no longer break down revenue by product lines, claiming this no longer properly reflects the company's growth. The announcement created a backlash, including headlines that claimed "Apple has something to hide."
On Wednesday we predicted that “even with stellar earnings results, Apple may top out.” Indeed, the price completed an H&S top in the midterm. Still, consider instituting a price and time filter if you intend to trade the stock, in order to avoid a bear trap. This is yet another example of a phenomenon we've previously noted: investors have become hard to please, dumping shares of a fundamentally sound company that has beaten expectations but provided softer guidance.
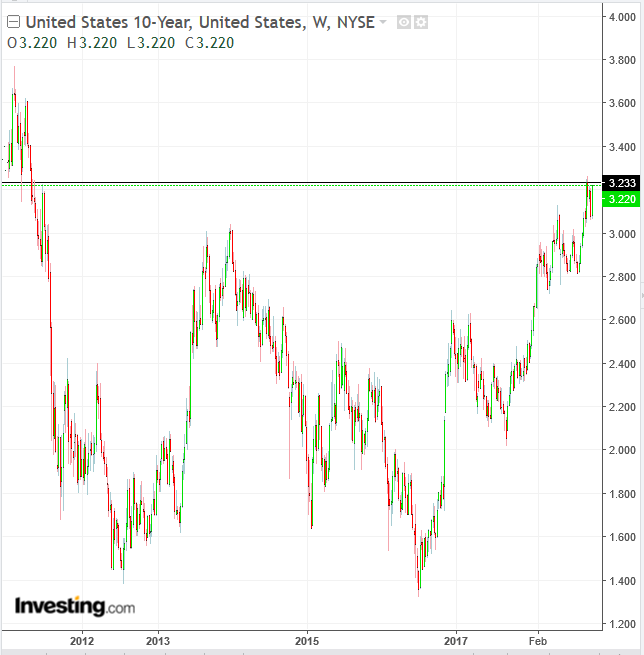
The 10-year Treasury yield jumped on Friday to 3.21 percent, the most in a month. The move was driven by speculation the Federal Reserve will resume its rate hike trajectory after Friday’s employment report demonstrated annual wage gains passed 3 percent for the first time since 2009. An advance of an additional 0.14 percent would cause the sovereign bond's yield to reach the highest level on a closing basis since 2011.
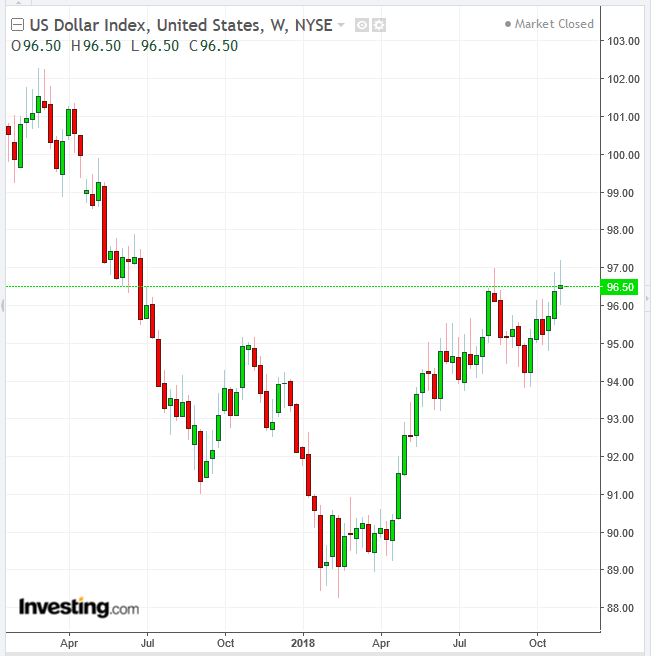
Expectations for higher borrowing costs as well as higher yields boosted the dollar, helping it hold onto gains, driving it to it's strongest position on a weekly basis since June 2017. The euro fell on reports that the ECB was considering new dovish measures, providing additional support for the USD.
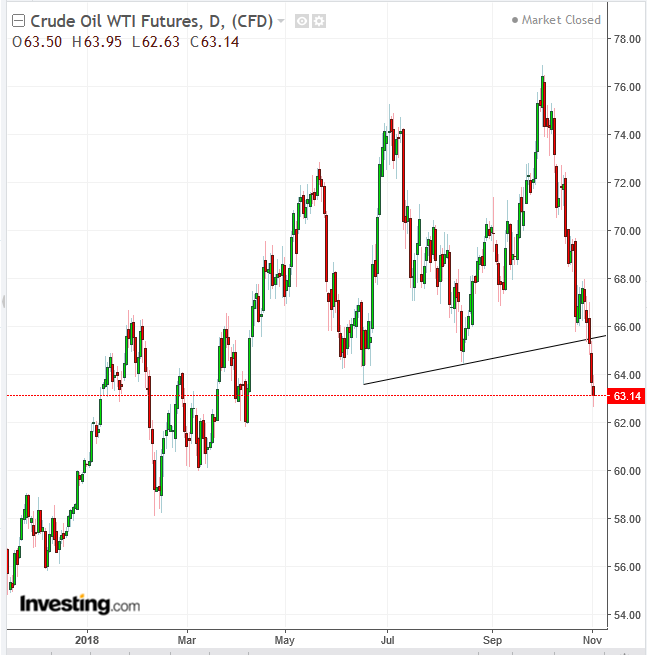
Oil fell Friday 0.86 percent for the fifth straight session of 6.58 percent, as fears over a supply disruption eased after the US reportedly agreed to give waivers to eight nations to continue importing Iranian oil. Technically, oil topped out, suggesting momentum is on the downside.
Overall, October will be remembered by investors as the month when the S&P 500 lost the most value since September 2011. Higher volatility is typical in the later part of the business cycle. However, judging the US-China trade dynamic so far, we expect a potential for exceptionally wild swings, with ongoing conflicting narratives.
Week Ahead
All times listed are EST
Sunday
21:45: China – Caixin Services PMI (October): forecast to fall to 52.9 from 53.1.
Monday
5:30: UK – Services PMI (October): expected to scale back to 53.3 from 53.9.
11:00: US – ISM Non-Manufacturing PMI (October): index forecast to fall to 59.3 from 61.6.
23:30: Australia – RBA Rate Decision: no change expected from the current 1.5% interest rate.
Tuesday
US Mid-Term Elections: Control of the US Congress is being contested, with implications for US policy. As well, some key gubernatorial races will be closely watched.
Wednesday
6:00: Eurozone – Retail Sales (September): forecast to fall 0.8% YoY from 1.8%; to rise to 0.1% from a decline of 0.2% last month.
11:00: Canada – Ivey PMI (October): index to rise to 50.9 from 50.4.
11:30: US – EIA Crude Inventories (w/e 2 November): stockpiles expected to rise by two million barrels from a 3.217 million barrel increase a week earlier.
21:00: China (Tentative) – Trade Balance (October): exports to fall to 12% YoY from a 14.5% increase in September.
Thursday
9:30: US – Initial Jobless Claims (w/e 3 November): claims to remain steady at 214K.
15:00: US – Fed Interest Rate Decision (delayed by a day due to US elections): while no change is expected at this meeting, a reference to the highest wage gains in 9 years may be the Fed’s case for higher borrowing costs, which should boost the dollar.
20:30: Australia – RBA Statement on Monetary Policy: hawkish remards could lift the Aussie.
21:30: China – CPI (October): likely to remain flat at 2.5% YoY, and 0.2% MoM from 0.7%.
Friday
5:30: UK – GDP (September), Trade Balance (September): GDP to rise 0.1% from 0.0% MoM, 0.6% from 0.4% QoQ and 1.5% from 1.2% YoY; and trade deficit to widen to £0.2 billion to -11.40 billion Market to watch: GBP crosses
9:30: US – PPI (October): forecast to be 0.3% MoM from 0.2%.
11:00: US – Michigan consumer sentiment (November, preliminary): index to edge down to 98.0 from 98.6.
