Markets traded in a risk-on fashion on Monday and during the Asian morning Tuesday, due to fresh positive headlines with regards to COVID-vaccine trials, as well as due to the progress made from EU leaders in finding common ground with regards to a recovery fund to stimulate their pandemic-hit economies.
RISK ASSETS GAIN, SAFE HAVENS SLIDE ON VACCINE AND EU FUND OPTIMISM
The dollar traded lower against all but three of the other G10 currencies on Monday and during the Asian morning Tuesday. It underperformed versus GBP, NOK, SEK, CAD, AUD, and NZD in that order, while it was found virtually unchanged against JPY, CHF, and EUR.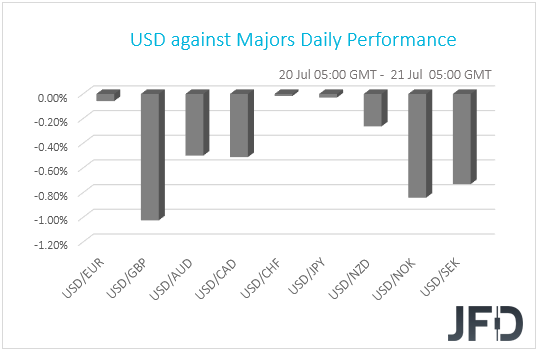
The weakness in the safe-havens dollar, yen and franc, combined with the relative strength in the commodity-linked CAD, AUD and NZD, suggests that markets traded in a risk-on fashion yesterday. Indeed, taking a look at the equity world, we see that major EU and US indices traded in positive waters, with the exception being UK’s FTSE 100, which may have come under selling interest due to the strengthening in the pound. Remember that many companies of the index generate profits in other currencies, so in a strengthening GBP environment, if those profits are converted to pounds, they worth less. The upbeat morale rolled over into the Asian session today as well. Although China’s Shanghai Composite was found virtually unchanged, Japan’s Nikkei 225 and Hong Kong’s Hang Seng are up 0.83% and 2.04% respectively.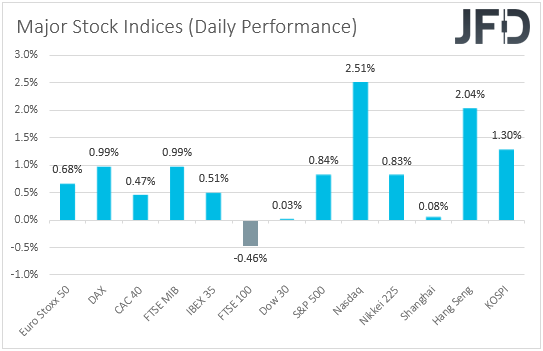
Following last week’s reports that Moderna (NASDAQ:MRNA) Inc’s experimental drug provoked immune responses, yesterday, fresh headlines hit the wires that the vaccine being developed by AstraZeneca (NYSE:AZN) and Oxford university produced immune response as well in its first human trial. US drugmaker Pfizer (NYSE:PFE) and German biotech firm BioNTech also provided additional promising data. Apart from the encouraging news with regards to a potential coronavirus vaccine, the progress between EU leaders in finding common ground over a recovery fund to stimulate their virus-hit economies may have also proved positive for investors’ risk appetite. This helped the euro rally to its highest level in over four months against the dollar, though the currency pulled back later in the day, with EUR/USD found virtually unchanged today.
As for our view, it has not changed though. As we noted last week, on the one hand, we have encouraging vaccine trials, which are very positive for the markets, as with a vaccine ready soon, governments may not need to proceed with new full-scale lockdowns, and thereby, allow their economies to continue recovering. On the other hand though, infected cases by the virus are still in acceleration mode, hitting a new daily record on Friday, while tensions between the US and China remain elevated, something that could jeopardize any progress made so far with regards to a trade accord. This suggests that both the bulls and the bears have ample reasons to step into the action, and as such, we would stay sidelined for now with regards to the broader market sentiment and wait for the fog to clear out.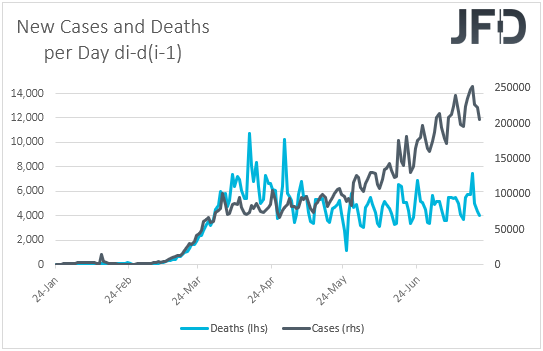
S&P 500 – TECHNICAL OUTLOOK
Yesterday, the S&P 500 finally managed to break and close above the June high, at 3233. The index also continues to trade above a medium-term tentative upside support line taken from the low of March 23rd. The positive price momentum seems to be picking up again, which suggests there could be more upside in the coming days, hence why we will take a bullish approach for now.
The break above the 3233 barrier, marked by the highest point of June, had potentially opened the door to some higher areas, as it confirmed a higher high. The index may now drift to the next possible resistance area between the 3311 and 3328 levels, marked by the high of February 24th and the low of February 21st respectively. Initially, the index may stall there for a bit, but if the buyers are still feeling comfortable, a break of that zone could set the stage for a move to the 3397 area, marked near the all-time high.
On the other hand, if the previously-mentioned upside line breaks and the price falls below the low of last week, at 3115, that may spook the buyers from the arena. The S&P 500 might then drift to the low of June 29th, at 2995, a break of which could set the stage for a slide to the lowest point of June, at 2936.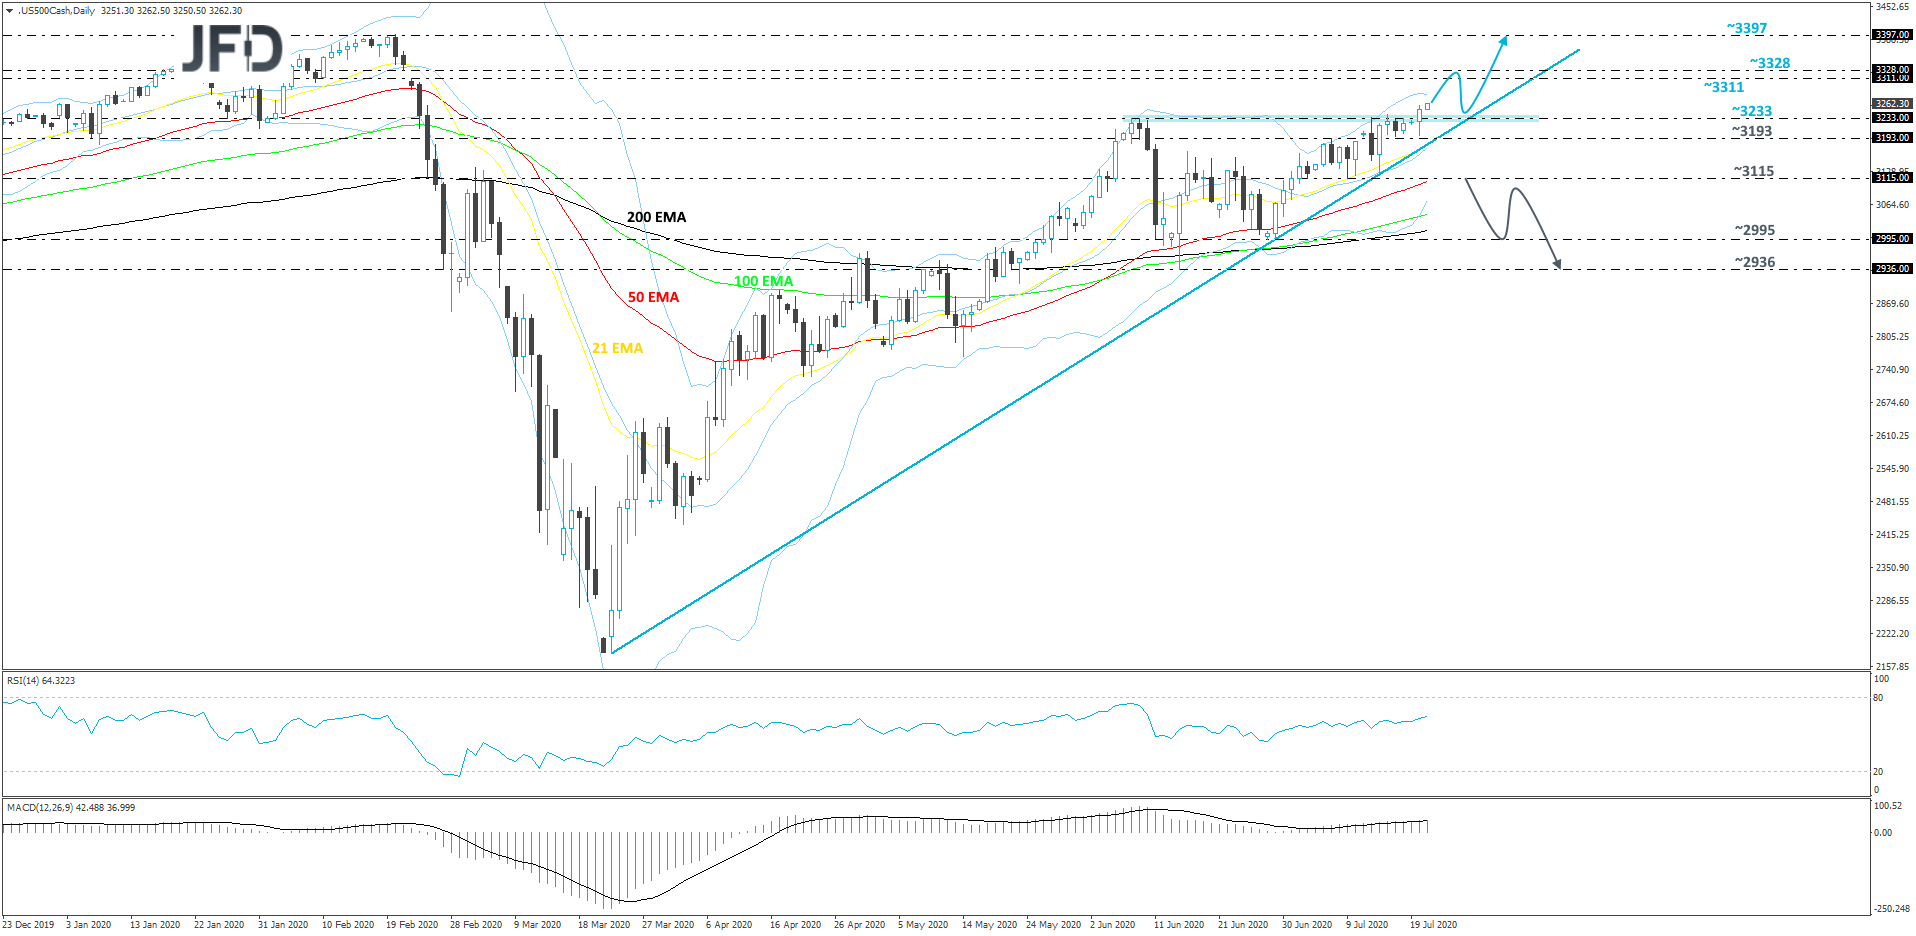
EUR/JPY – TECHNICAL OUTLOOK
EUR/JPY failed yesterday to make its way above the high of last week, at 122.97, and this morning we are seen a small correction lower. This move could still be classed as a temporary correction, as long as the rate stays above a short-term tentative upside support line drawn from the low of July 10th. We will take a somewhat positive stance, at least for now.
If the rate moves a bit further down, it may test the aforementioned upside line, which if remains intact could attract the bulls back into the field. If so, EUR/JPY may climb back to the high of last week, a break of which would confirm a forthcoming higher high and the pair might travel to further north. That’s when the rate could end up hitting the 123.27 hurdle, or even the 123.63 level, marked by an intraday swing low of June 5th.
Alternatively, if the aforementioned upside line breaks and the rate slides below the low of July 20th, at 122.25, that may spook new buyers from entering, as such a move might increase the pair’s chances of falling further. That may also signal a change in the short-term trend, potentially opening the way towards the 121.81 zone, marked by the lows of July 15th and 16th. EUR/JPY could stall there temporarily, or even rebound somewhat. That said, if the rate is not able to get back above the aforementioned upside line, the bears might take charge again and drive the pair lower. That’s when we will aim for the 121.81 obstacle again, a break of which could set the stage for a drop to the 121.46 level, marked by the low of July 14th.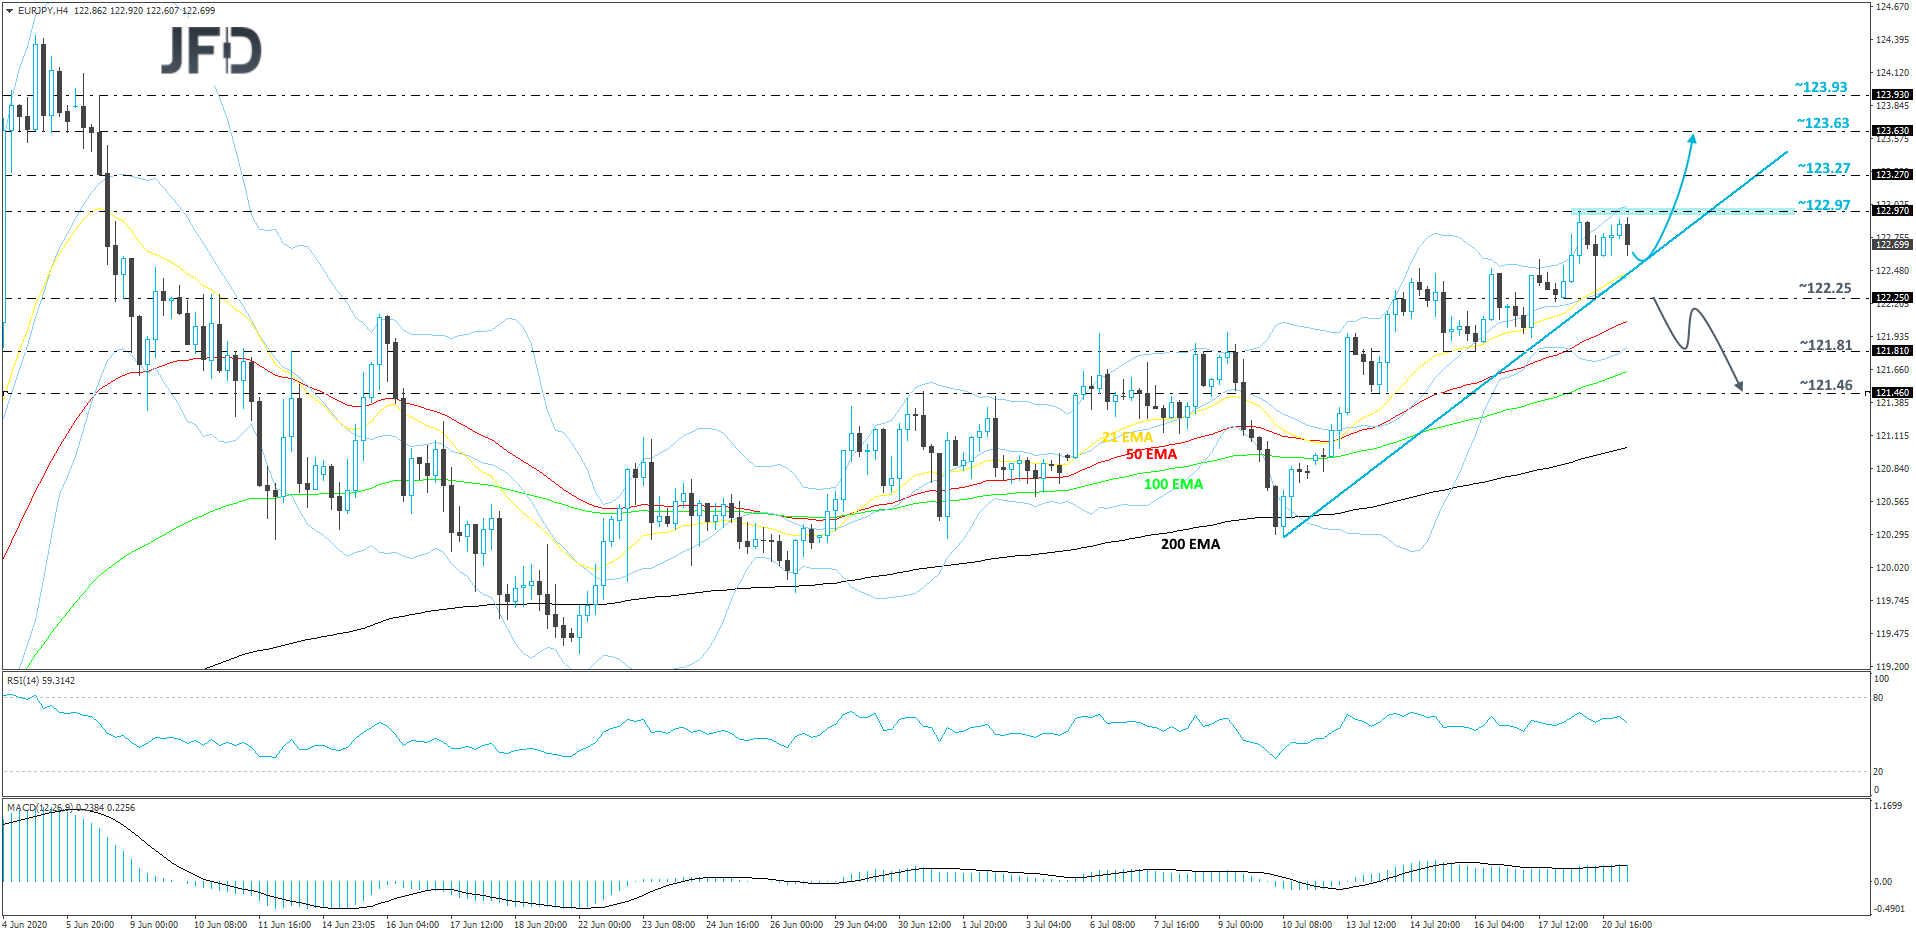
AS FOR TODAY’S EVENTS
The most important release on today’s calendar is Canada’s retail sales for May. Both the headline and core sales are forecast to have rebounded 20.0% mom and 12.5% mom after sliding 26.4% and 22.0% respectively. At last week’s gathering, the BoC kept its policy unchanged, and although officials noted that interest rates will stay untouched until the 2% inflation target is sustainably achieved, they added that they stand ready to adjust their programs if market conditions change. In our view, a rebound in retail sales, combined with a potential rebound in the CPI rates tomorrow, may allow BoC policymakers to stay sidelined for another gathering.
From the US, we get the API (American Petroleum Institute) weekly report on crude oil inventories for last week, but as it is always the case, no forecast is available.
On the political front, US President Trump’s advisers and congressional Democrats are set to discuss plans on how to respond to the coronavirus outbreak. The discussion may reveal some details with regards to another fiscal stimulus package, and thereby, it may prove a driv
