Market Brief
In Australia, private capital expenditure (capex) contracted 5.2%q/q in the first quarter of 2016, missing consensus for a smaller decrease of -3.5% and also below the upwardly revised figure of +1.8% in the last quarter of 2015. On a year-over-year basis capex contracted -15.4% as spending on equipment, plants and machinery slid 9.2%y/y (s.a.), while spending on buildings and structures collapsed 18.8%y/y (s.a.). Initially, AUD/USD fell sharply on the news as it hit 0.7162. However, the Aussie bounced back above the 0.72 threshold, supported by rising commodity prices. Crude oil continued to rally hard on the back of fading supply glut issues as US stockpiles dropped 4.2k over the last week, missing the forecast for a smaller reduction of 2k barrels. In London, futures rose 0.70% to $50.09 a barrel, while US futures stumbled on the $50 threshold, stabilising at around $49.90 a barrel. We still believe that there is some upside potential for crude oil prices; however it would be difficult to break the $60 level given the elevated amount of inventories.

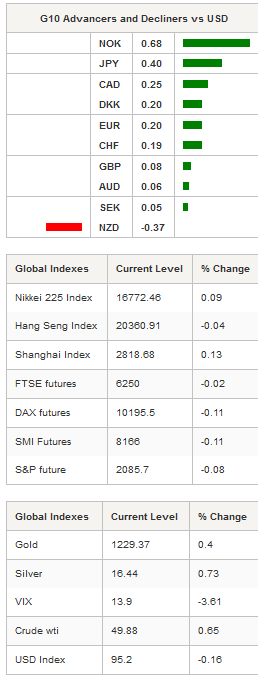
With crude oil prices moving higher, the Norwegian krone followed the trend. USD/NOK slid 0.70% to 8.3070 after hitting 8.4065 amid growing Fed expectations for normalising short-term rates. We expect the currency pair to continue moving lower as the NOK will find a strong support from rising oil prices, while the USD should retreat as the market starts to price out a June rate hike.
Precious metals are also taking advantage of the weaker dollar as the yellow metal rose 0.39% in Tokyo. Silver was up 0.72%, while platinum jumped 1.54% and palladium surged 2.05%. Gold has reached the bottom of its medium-term range and should therefore start recovering. A strong support can be found at around the $1,200-$1,220 area, while the top of the range is at $1,300.
In the equity market, Asian regional markets were mostly trading in positive territory. In mainland China, the Shenzhen and Shanghai Composites were up 0.13% and 0.31% respectively. In Japan, the popular Nikkei 225 edged up 0.09%, while the Topix index remained unchanged. Offshore, Hong Kong’s Hang Seng edged down 0.04% and Taiwan’s TWSE traded flat (-0.02%). In Europe, equity futures are once again trading in negative territory - just like yesterday - but may turn positive following Asia's lead. US futures are mixed.
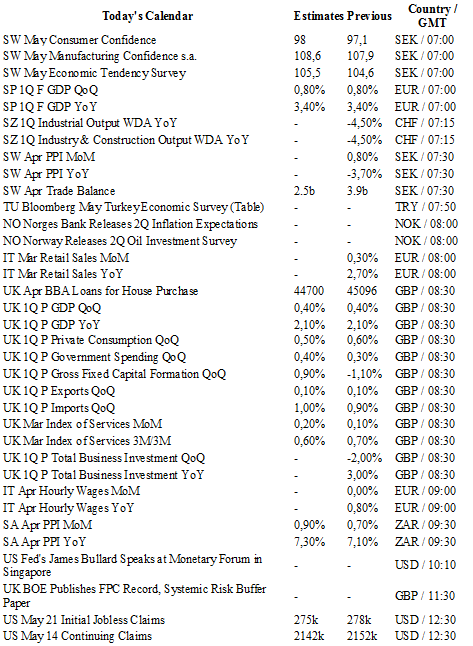
Today traders are awaiting a final reading of Spain’s GDP figures for Q1; industrial output from Switzerland; PPI from Sweden; initial jobless claims, durable goods orders and pending home sales from the US; gold and forex reserves from Russia.

Currency Tech
EUR/USD
R 2: 1.1479
R 1: 1.1349
CURRENT: 1.1171
S 1: 1.1058
S 2: 1.0822
GBP/USD
R 2: 1.4969
R 1: 1.4770
CURRENT: 1.4732
S 1: 1.4404
S 2: 1.4300
USD/JPY
R 2: 111.91
R 1: 110.59
CURRENT: 109.88
S 1: 108.23
S 2: 106.25
USD/CHF
R 2: 1.0257
R 1: 1.0093
CURRENT: 0.9900
S 1: 0.9751
S 2: 0.9652
