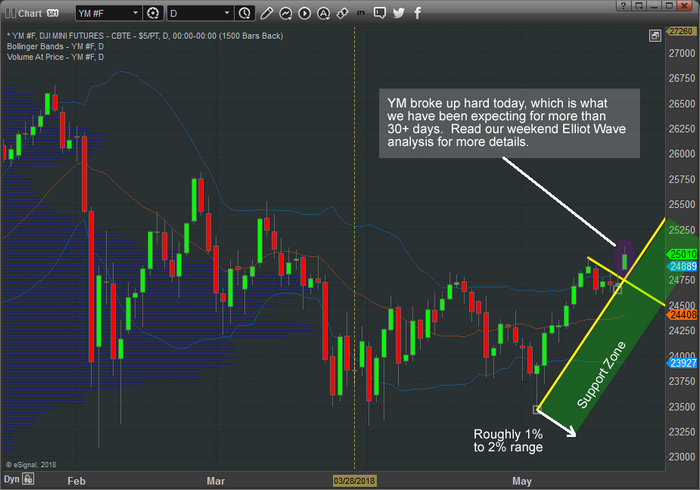
At this point, all we can say is “Wow – did you see that breakout?”. If you have been following our analysis, you already know we’ve been predicting this upside price move for over 4 weeks with our specialized price modeling systems, cycle analysis models and other specialized trading tools. Last weekend, we posted very detailed analysis of the Elliot Wave and Fibonacci price levels that suggest we could see another upside price move that no one is expecting.
Please take a minute to read our two recent Elliot Wave research posts before you continue reading this post. We want to make sure you understand the components of this price setup and what we believe will be the most likely outcome.
The upside breakout in price on Monday actually originated with an upside gap Sunday night. This upside gap was likely the result of a combination of factors, yet it supported our analysis that the US major markets are poised for a dramatic upside price move soon. Our Elliot Wave analysis suggested we could be setting up for a Wave 3-d upside price move that will end with a corrective price move sometime in early/mid 2019. In order to confirm this analysis, we have to see new all-time price highs established before the end of 2018 with a solid upside price rally in place.
While the YM (Dow) was the only US major to show a clear upside price breakout, we believe the other US major markets will follow along soon enough. We have highlighted what we believe is a critical support zone on this YM chart to try to illustrate that price rotation is normal. We expect to see a 1~2% price rotation throughout this upside move that is completely natural and healthy for the markets.

Again, this is completely natural as the YM (Dow Jones index) is tied to the Dow Industrials and the Transportation Index which are breaking out this week. A breakout move like this in the YM suggests that the overall US economy is strengthening and that the future expectations are good that increased levels of transportation of goods will unfold. In our next post we will go into detail on these two sectors and show you some new opportunities emerging.
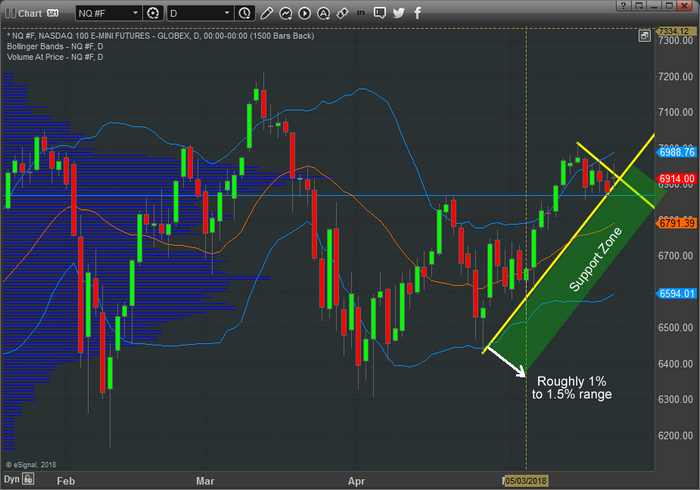
Additionally, we wanted to show you this NQ chart that is waiting for breakout confirmation from price. Sometimes, the US majors do not always move in unison. There are times when the S&P or the NASDAQ will move with greater velocity while the other US majors appear to move in a more muted manner.
The NQ, being tech-heavy, relies more on earnings and revenues from the FANG group. A move higher in the NQ would indicate that future earning and revenue expectations are strengthening. This is something we believe will happen in the near future as we expect the NQ to follow the YM with an upside price breakout very soon.

We are still very early in this trading week and we have lots of time for this move to unfold. We can help you find and execute better trades with our advanced market timing and trade setups for active traders. Our members already know what our predictive modeling systems are suggesting for the next 5+ weeks.
Disclaimer: This material should not be considered investment advice. Technical Traders Ltd. and its staff are not registered investment advisors. Under no circumstances should any content from websites, articles, videos, seminars, books or emails from Technical Traders Ltd. or its affiliates be used or interpreted as a recommendation to buy or sell any security or commodity contract. Our advice is not tailored to the needs of any subscriber so talk with your investment advisor before making trading decisions. Invest at your own risk. I may or may not have positions in any security mentioned at any time and maybe buy sell or hold said security at any time.
