After Tuesday's losses, yesterday it was the turn of moving averages to step in as support. Action for the last couple of days does look like washout trading to shake out weak-holding longs
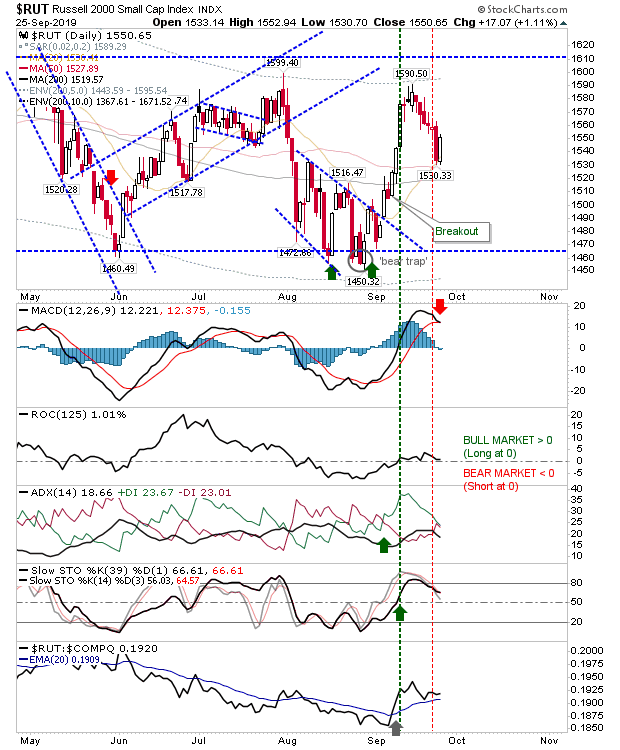
The Russell 2000 suffered the most on Tuesday but did well to attract buyers yesterday at its converged 50-day and 20-day MAs. While yesterday's buying was good, it wasn't enough to prevent a MACD trigger 'sell'.
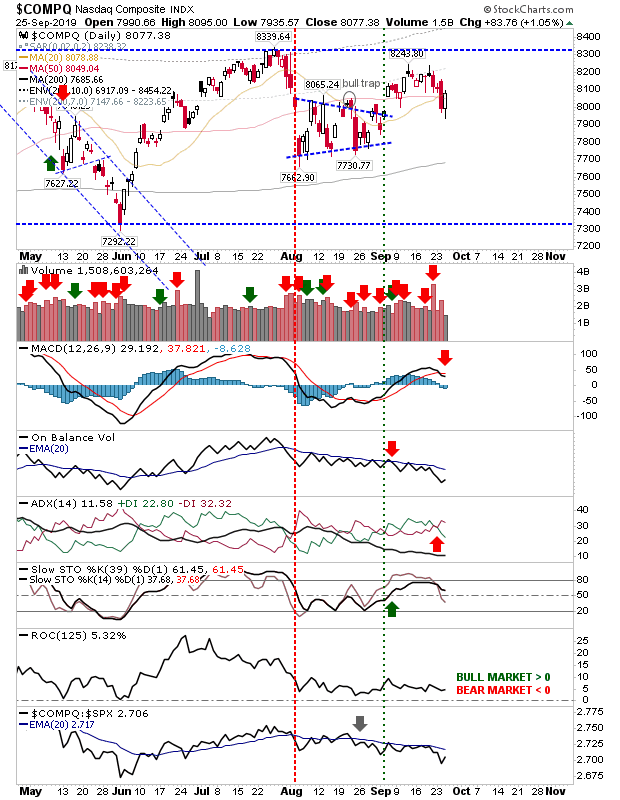
The NASDAQ recovered from Tuesday's loss of its 20-day and 50-day MAs with a bullish piercing pattern. However, like the Russell 2000, it couldn't escape the MACD trigger 'sell.' It also has more bearish technicals, although price action remains good.
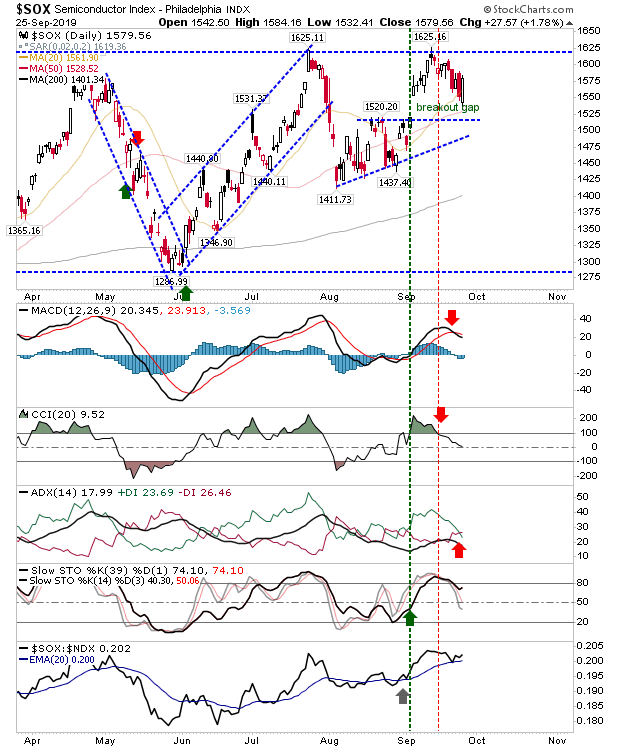
The Semiconductor Index also had a strong day yesterday, but it came close to invalidating the breakout gap. It really needs to push on if it's not to lose momentum, particularly as the MACD, CCI and ADX have turned bearish.
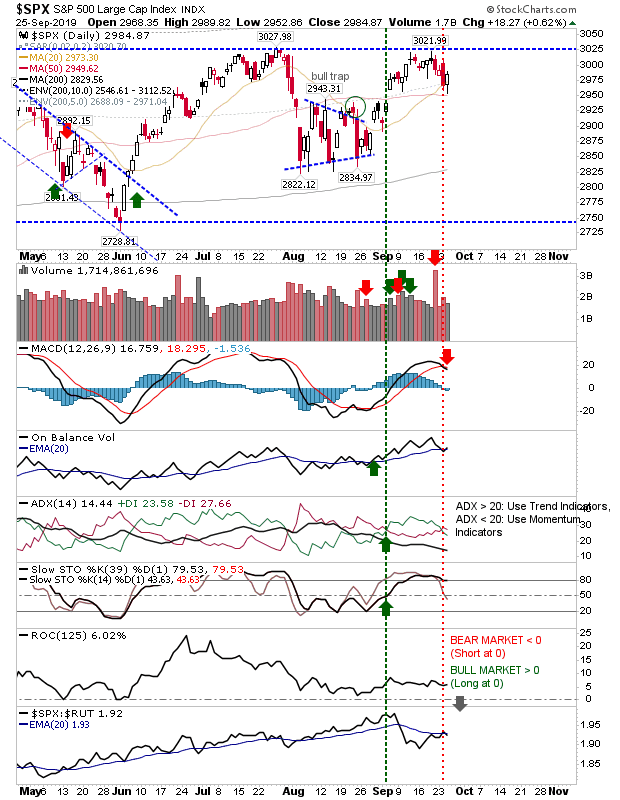
Not to be outdone, the S&P rallied off its 50-day MA but couldn't avoid its own MACD trigger 'sell'.
It's a similar picture for the Dow Jones Index, although it too has a MACD and ADX 'sell' trigger to contend with.
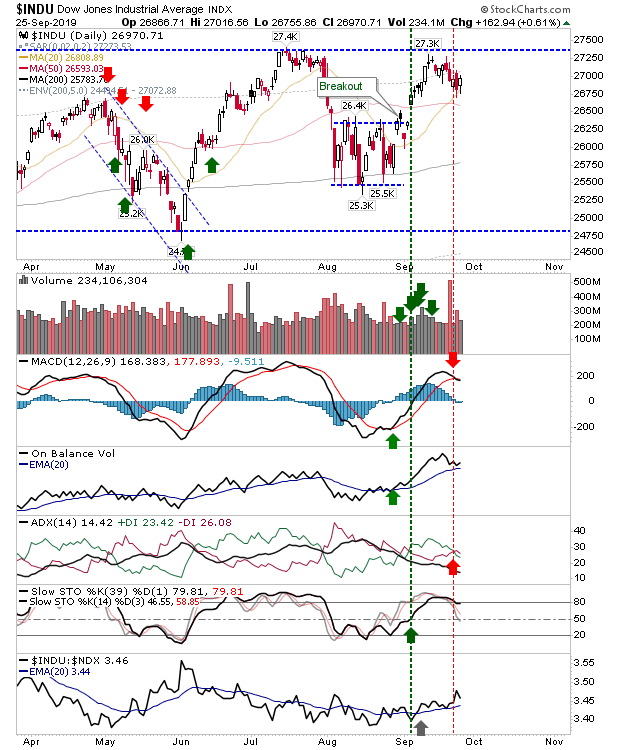
Bullish traders will need to push yesterday's gains if expanding technical weakness is not to take root and swing Algo traders into bearish strategies—pressuring bull traders' positions.
