Thursday September 28: Five things the markets are talking about
The Trump reflation trade is coming back in vogue with a bit more details on the U.S tax plans.
The dollar and global sovereign yields have rallied after President Trump yesterday proposed the biggest shake-up of the U.S tax system in thirty-years and strong U.S data further supports the case for another Fed rate hike later this year.
Nevertheless, investors should expect the proposed bill to face an uphill battle in congress with Trump’s own Republican Party divided over it and Democrats hostile as critiques suggest the plan favours businesses and the rich and could add trillions of dollars to the U.S deficit.
Today’s U.S data on GDP and personal spending (08:30 am EDT) should provide further clues as to the potential Fed policy path.
1. Stocks mixed signals
Global equities trade mixed as investors began to assess the implications of the much-anticipated U.S tax proposal.
In Japan, stocks rebounded overnight after Wall Street gained and the dollar rallied against the yen (¥112.81) on hopes that President Trump may be making progress on his tax plan. The Nikkei gained +0.5%, while the broader Topix rallied +0.7%.
Note: Japan’s PM Abe dissolved lower house to make way for snap elections announced for Oct. 22
In Hong Kong, stocks fell, mirroring weakness in some other Asian markets, as investors worried about a possible slowdown in China await Q3 economic data. The Hang Seng index ended down -0.8%, while the China Enterprises Index lost -1.5%.
In China, equities were little changed as investors await Q3 data and counted down to a weeklong National Day holiday starting on Sunday. The blue-chip CSI300 index was unchanged, while the Shanghai Composite Index was down -0.2%.
Note: Mixed August data have raised concerns that China economic recovery could be losing steam.
In Europe, regional indices are trading mostly higher as rising bond yields lift the financial sector, materials stocks are being pulled own by commodity prices, including oil which is impacting energy stocks.
U.S stocks are set to open little changed.
Indices: Stoxx600 +0.1% at 385.8, FTSE +0.1% at 7319, DAX +0.4% at 12701, CAC 40 +0.2% at 5293, IBEX 35 +0.3% at 10399 , FTSE MIB +0.1% at 22653, SMI +0.2% at 9117 , S&P 500 Futures flat

2. Oil steadies as North Iraq, Kurdish pipeline stays open, gold melts
Oil prices trade steady, taking a breather after gains spurred by rising tension in northern Iraq following Kurdistan region’s vote for independence in a referendum.
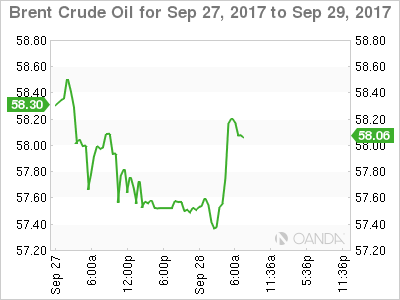
Brent crude oil is unchanged at +$57.90 a barrel. On Tuesday, it hit a two-year high print of +$59.49 after Monday’s referendum vote prompted Turkey to threaten to close the region’s oil pipeline, before pulling back.
U.S. light crude is +5c higher at $52.19 after rising +26c yesterday to just below a five-month high.
U.S. crude prices found some support from a surprise fall in U.S stocks. Crude inventories fell -1.8m barrels last week according to the U.S. Energy Department, versus forecasts for a +3.4m build.
Note: The crude ‘bears’ remain sceptical about further price gains due to higher oil output from the U.S. The EIA said that production from wells in shale formations would rise for a 10th month in a row in October.
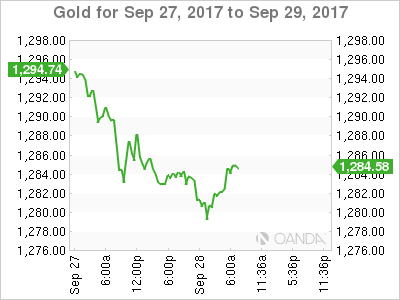
Gold fell to a new one-month low overnight as the ‘big’ dollar rallied on expectations of a U.S interest rate hike in December. Spot gold is down -0.2% at +$1,278.36 per ounce, as strong U.S economic data took sheen off the precious metal.

3. A global bond rout deepens
The prospect of higher U.S debt levels and expectations for another Fed hike has sent 10-year Treasury yields to their highest since mid-July, with the 2-10 year yield curve steepening to its highest in a month.
Comments this week from Fed Chair Janet Yellen that the U.S central bank needs “to continue with gradual rate hikes” have cemented expectations for policy tightening by year-end.
Note: U.S two-year notes are the most sensitive to overnight rates – yields have backed up to a nine-year high of +1.49% in anticipation of a rate rise in December.
The yield on U.S 10’s has gained +3 bps to +2.34%, the highest in more than two months. In Germany, 10-Year Bund yields increased +3 bps to +0.49%, the highest in almost two months, while the U.K’s 10-Year Gilt yield has climbed +1 bps to +1.398%, the highest in eight months.

4. Dollar gets a lift from Tax cuts, and Fed expectations
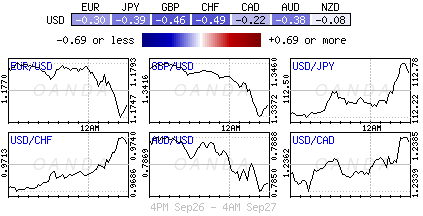
Expectations that the Fed will continue to raise interest rates and the prospect of U.S tax reform has boosted the dollar across the board. Are its gains short lived?
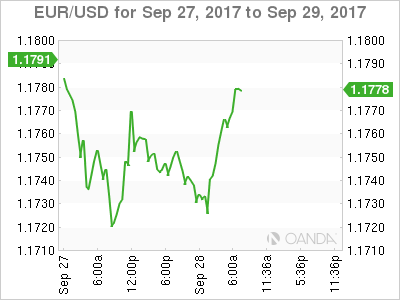
The EUR (€1.1764), GBP (£1.3373), and CAD (CA$1.2478) are all trading higher from their worst levels seen overnight, as too is yen (¥112.82) with the dollar after having hit a three-month high of ¥113.26 yesterday.
EUR ‘bears’ continue to see a potential risk of the single unit falling as low as €1.15 if investors remain worried about German politics and optimism about the U.S.
Note: After Sunday’s German elections, worries have resurfaced about the rising populism in the eurozone, and about whether Chancellor Merkel and French President Macron will be able to strike a deal on deeper eurozone financial integration.
Down under, the Reserve Bank of New Zealand (RBNZ) left rates unchanged as expected yesterday, noting that weaker currency ((NZ$0.7186) is best for dealing with “tradable inflation.”
5. Eurozone business, consumer confidence surges
Data this morning showed that the EC’s Economic Sentiment Indicator for September was stronger than expected, rising to 113.0 from 111.9, compared with a consensus forecast of 112.0.
It’s the highest level since June 2007, and included Germany, France, Italy and Spain. The rise is a fresh sign that the economy has grown in Q3 at roughly the pace it did in Q2, and suggest that the region is poised for robust end to the year.
The data would also suggest that businesses and households are not that concerned about the prospect of a reduction in ECB stimulus sometime soon.

