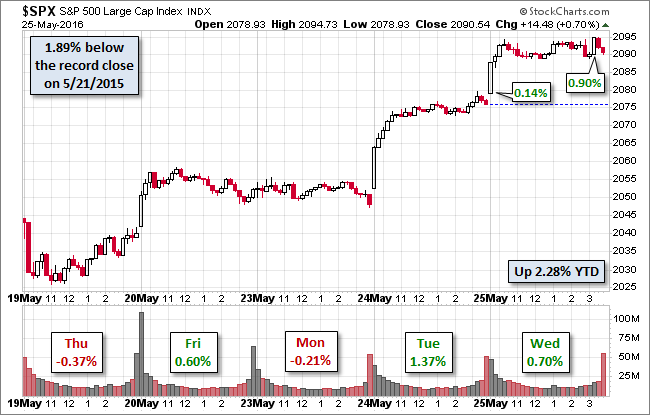
Equity markets around the globe had another good day on Wednesday. In the east, the Nikkei rose 1.57% and the Hang Seng 2.71%. The Euro STOXX 50, our favorite surrogate for Europe, rose 1.71%. The S&P 500 followed Tuesday's pattern of an opening surge. It then drifted sideways in a narrow range though the rest of the day, hitting its 0.90% intraday high about 30 minutes before the close, which saw a trimmed gain of 0.70%, the second day of the latest advance, although about half Monday's 1.37% closing gain.
The yield on the 10-year note closed at 1.87%, up one basis point from the previous close.
Here is a snapshot of past five sessions in the S&P 500.
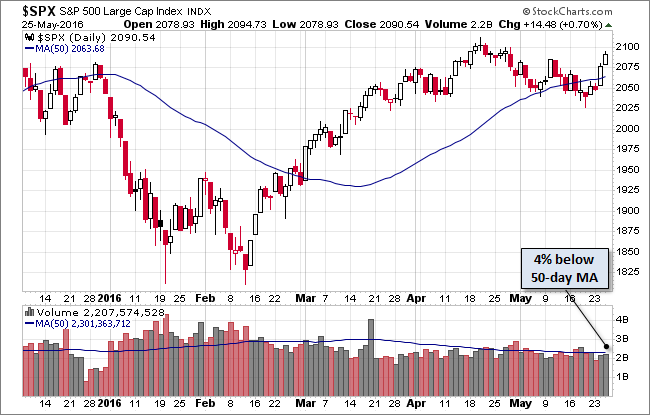
Here's a daily chart of the index, which rose higher above its 50-day moving average. Volume was unremarkable.
A Perspective on Drawdowns
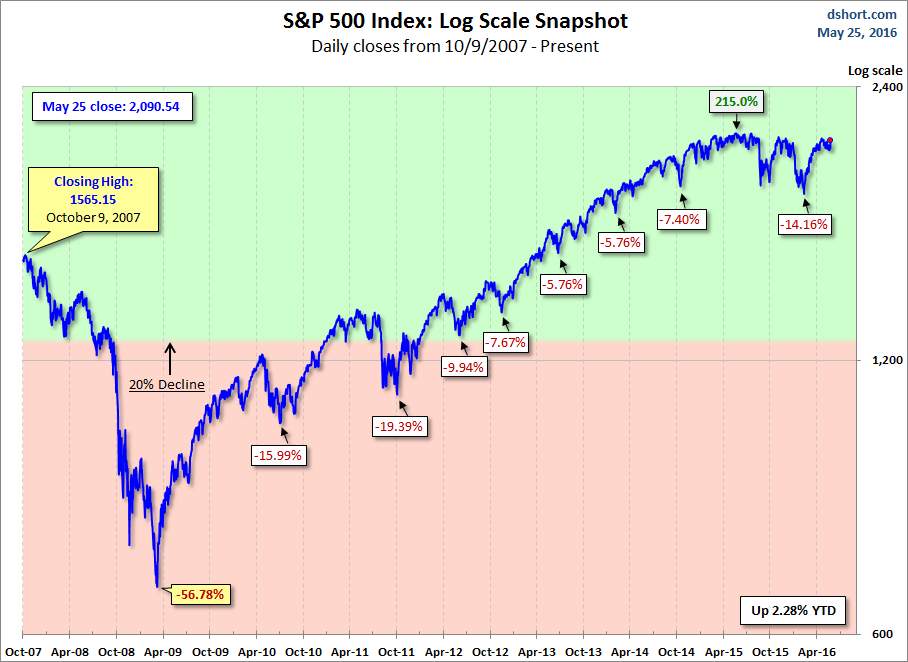
Here's a snapshot of selloffs since the 2009 trough.
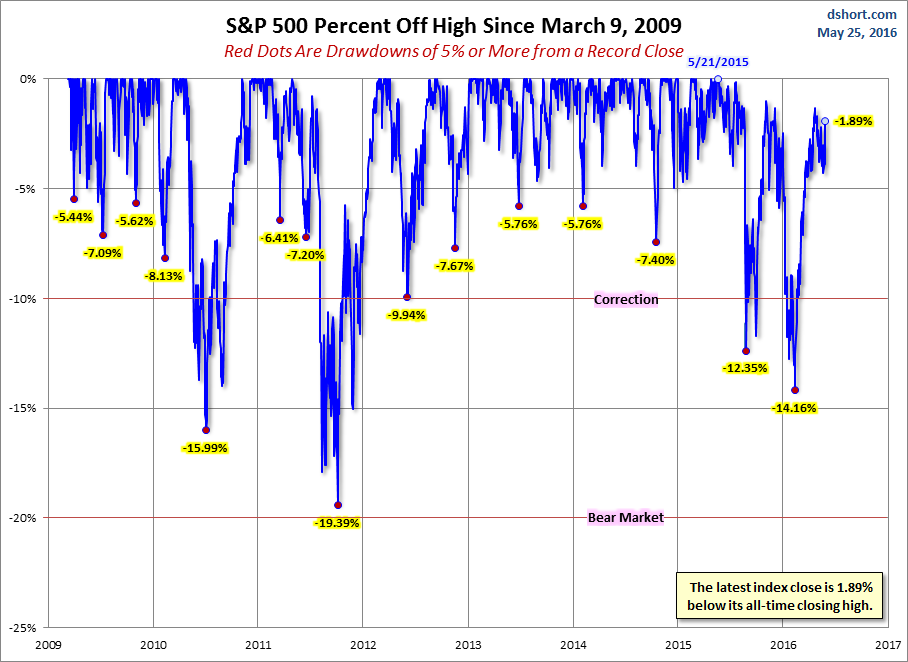
Here is a more conventional log-scale chart with drawdowns highlighted.
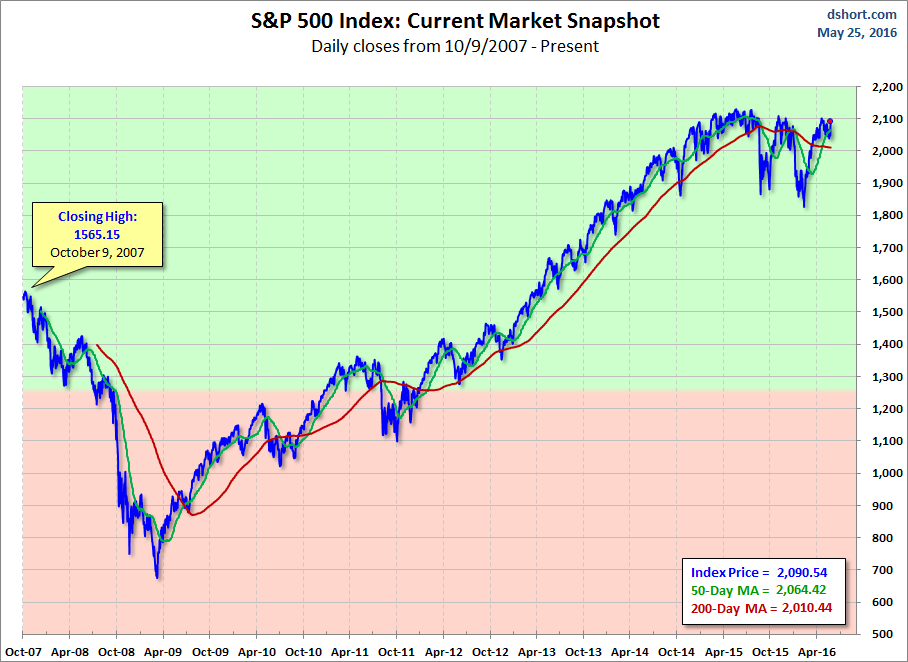
Here is a linear scale version of the same chart with the 50- and 200-day moving averages.
A Perspective on Volatility
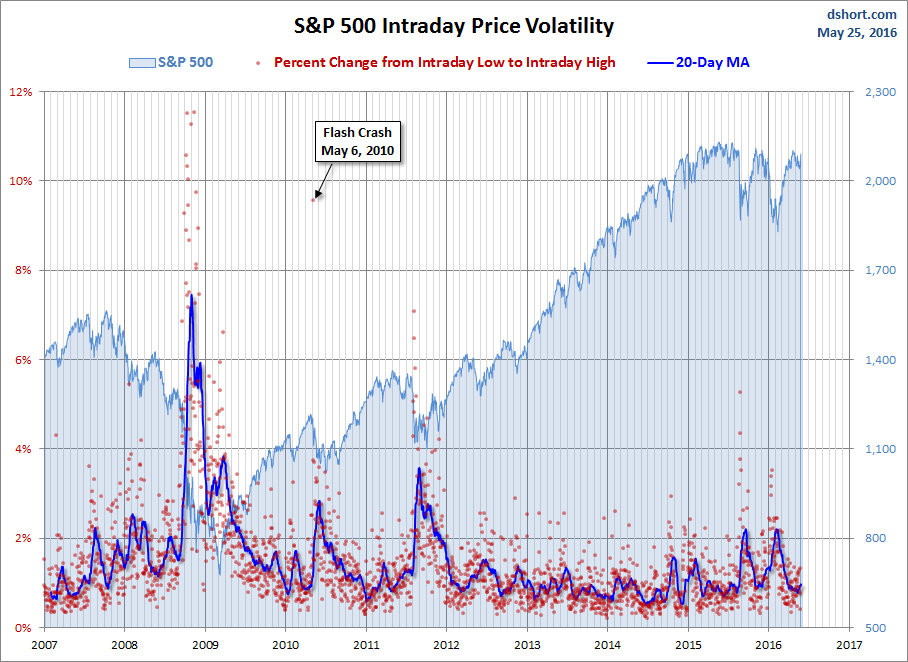
For a sense of the correlation between the closing price and intraday volatility, the chart below overlays the S&P 500 since 2007 with the intraday price range. We've also included a 20-day moving average to help identify trends in volatility.
