If you have ever driven on California’s Pacific Coast Highway, you understand risk. For those that haven’t made the drive, you are missing out on a spectacular winding road perched between a steep cliff and the ocean well below. Staying safe on this harrowing road requires strong driving skills and a good set of brakes.
Above and beyond what is in the driver’s control, the essential defense protecting drivers are the guard rails. If the PCH were fortified with 20-foot concrete walls, the risks of driving the road would be minimal but the incredible views lost. Conversely, if there were no guardrails, the risks increase substantially. A healthy compromise lies between these two extremes.
Investors also have the ability to employ guardrails in the market. Sometimes they are large and protective. Other times they are negligible. Unfortunately, most investors have little appreciation for these invisible guardrails and which type of investors manage them. In reality, the efficacy of market guard rails’ should largely determine our risk-taking stance.
Credit
Before progressing, we would be remiss if we did not thank Steven Bregman from Horizon Kinetics. Steve brought the pitfalls of passive investing to our attention over six years ago. Here is a great speech he gave at the Grants Fall 2016 conference.
Also, Chris Cole and Mike Green have done substantial work in quantifying the risks associated with the increasing popularity of passive strategies. The following offers an outstanding interview of Mike Green by Grant Willams.
Passive versus Active
The market guardrails we allude to are based on the capabilities of active investors. Before explaining, it is worth a short review on passive and active investment strategies.
In 2016, we wrote Passive Negligence, the first of many articles on this topic. Per the article:
“Passive index strategies are all the rage. Investors, desperate for “acceptable” returns are investing in funds whose value is directly linked to stock market indices. Unlike active funds, indexed funds do not perform investment analysis and are not looking for sectors or companies that offer greater return potential than the market. They do one thing, and that is replicate a particular equity index.”
In 2016 passive index strategies were “all the rage.” Today they are the market. Active investors have become endangered species. Due to poor relative returns and short-term thinking clients, many active professionals have been forced to become less value and more growth oriented. Failing to adapt ultimately means business failure as clients flee to the growth/passive style. Similarly, most individual active investors have similarly swapped active for passive strategies.
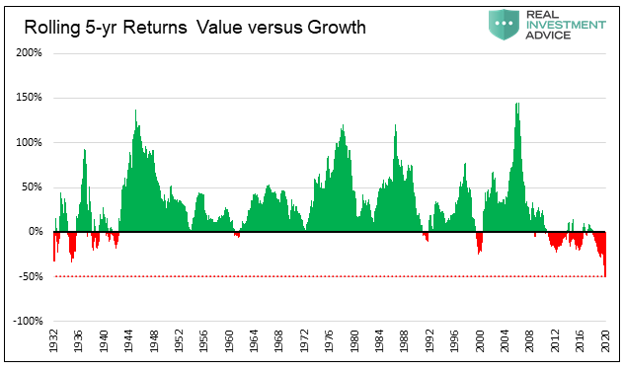
The graph below shows how value investors (active) have recently fared versus growth investors (mostly passive). The duration and magnitude of value’s underperformance is unprecedented.
Passive in Action
In the article five years ago we also wrote:
“In other words, the prices of underlying stocks will increasingly rise and fall together in correlation with the market and not based on their individual merits.”
Little did we know how profound those words would be. In “How to Find Value in an Upside Down World” we show the following graph.
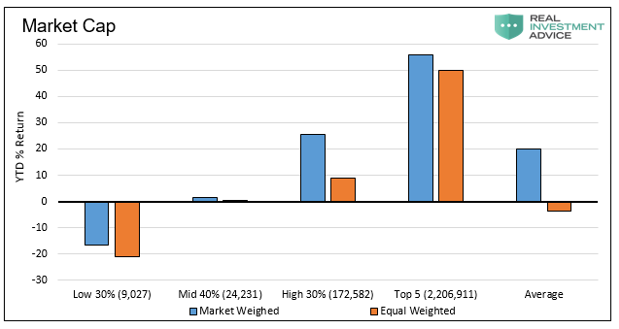
As of September 2020, year to date returns were highest for the largest companies and lowest for the smallest within the S&P 500. The return differentials are stunning. As the saying goes, size matters. It appears that size is all that matters.
As we wrote:
“The S&P 500 and NASDAQ are market-cap-weighted indexes, meaning the largest companies contribute more to the index than the smallest.”
Ergo, when passive investors buy the index, they are mainly buying the largest companies.
Value
Active investors seek out value. While value investing is defined in many ways, it generally means buying assets they deem cheap. Conversely, they tend to sell assets that fulfill their valuation forecast and become overpriced. Some active investors also short overpriced assets.
With that in mind, we present some graphs from the same article.
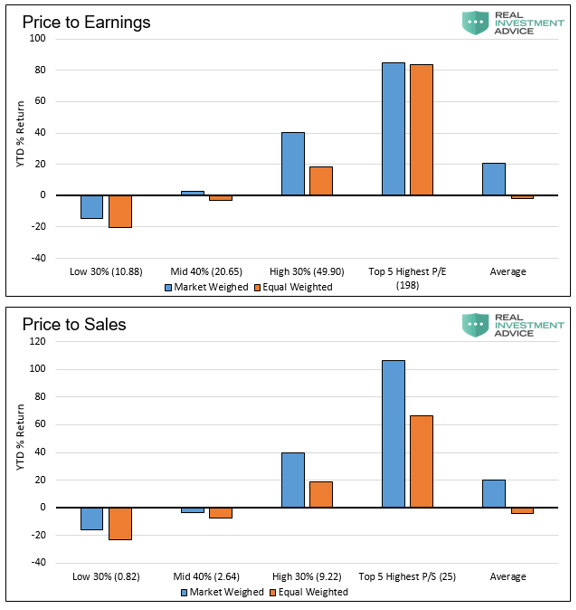
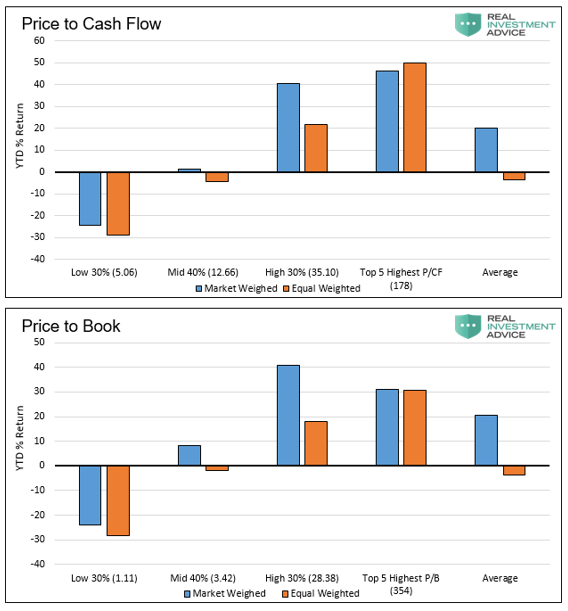
As shown, the companies with the best fundamental ratios had the worst performance.
From January to September, value was left for dead. The only thing that seems to matter to investors is market cap.
These results demonstrate that value investors are not a viable force in the market. The activities of those who are left are being overwhelmed by the growing preference for passive investing.
Active Guardrails
The graph below highlights the exodus from active to passive strategies over the last 12 years.
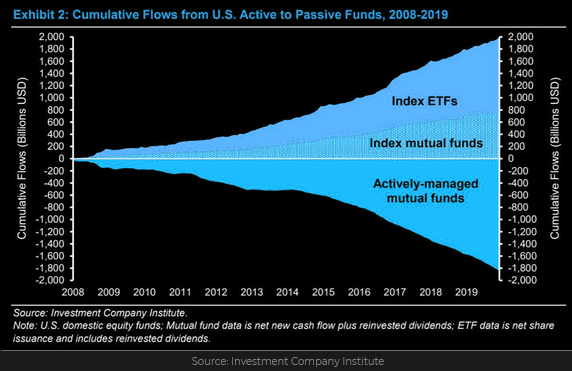
The obvious takeaway from the graph is the larger role of passive investors (net inflows) and the smaller share of active investors (net outflows). What is not obvious but of utmost importance to the health of the market are the repercussions of the dramatic shift taking place.
To help you understand the role active investors play, let’s consider a simple and somewhat hypothetical case. From 2010 to late 2019, Apple’s price to earnings ratio was between 10 and 20. In this case, it should be self-evident that active investors might generally view Apple (NASDAQ:AAPL) as cheap at 10 and expensive at 20. By contrast, passive investors, are indifferent at any P/E.
As shown below, P/E gyrates in the range. As it approaches the bounds, active managers get involved. Their interest provides buying and selling pressure to regulate the range. Active investors have enough market share in our example to uphold the range.
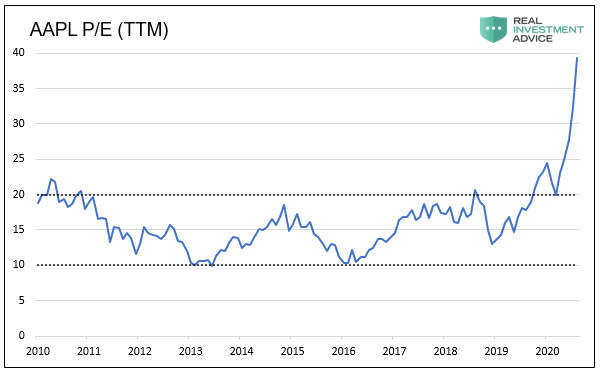
The graph shows that active investors may have lost enough market share in 2019 and could not provide their protective services. It is important to note that there is little about Apple’s prospects to be giddy about. Their earnings have been flat for the last five years.
In reality, active investors have many different views and opinions. They also have different strategies and vastly different evaluations on rich versus cheap. That said, the more active investors there are, the more prices are grounded to historical valuation norms. In other words, active investors reduce volatility, and therefore risk. Active investors are the guardrail.
Quantifying our Guardrails
Market and individual stock guardrails can be thick or flimsy. Also, there is not one proverbial guardrail but many based on the differing opinions of active investors. Regardless, the ability of active investors to provide a valuation check is purely a function of how powerful active investors are.
The question, therefore, is at what point passive investors negate the ability of active investors to regulate markets.
Chris Cole of Artemis, in his brilliant article “What is Water?,” helps put a number on our question.
When passive participants control 60%+ of the market the simulation becomes increasingly unstable, subject to wild trends, extreme volatility, and negative alpha. In the real world, because the ratio between active to passive is not constant, the instability threshold will occur at a much lower threshold as investors shift their preference to passive in real-time.
The irony of the Bogle-head crowd is that they tout efficient market hypothesis to support passive investing while simultaneously failing to comprehend how the dominance of the strategy causes markets to become highly unstable and inefficient. The most immediate realities are the ones that are the hardest to see… If you want to know when volatility will truly arrive, watch the shift in the medium.
The “medium”, in Cole’s terminology, is the balance between the roles of active and passive investors. He computes that when passive investors are more than 42% of the market, volatility increases and active investors gain an edge. As he writes, above 60%, the market lacks guardrails. Without guardrails, active investors have a considerable advantage as price becomes grossly detached from fundamentals.
Summary
The massive surge in passive strategies’ popularity has pushed the market to the brink of instability. Instability can result in price surges to unprecedented valuations. It can also produce immense volatility and tremendous price declines, as we saw in March. Volatility is here to stay as long as investor preferences remain the same.
There are no longer guardrails on our winding road of wealth accumulation. Those guardrails have been temporarily put out to pasture in favor of the laziness of passive strategies. Most troubling is that so few investors, many of which are heavily dependent on their investment portfolios, understand there are no guardrails for their wealth.
As you would drive on the PCH without guardrails, we recommend managing your wealth with the same attention. This article is not a recommendation to divest and sit in cash. However, it should serve as a warning that the hair raising declines in March, and vertical surge afterward may not have been an anomaly but a preview of things to come.
