“When the world turns upside down, the best thing to do is turn right along with it.” – Mary Poppins
Is Mary’s advice proper when it is your hard-earned wealth at stake?
There is no doubt that investors are living in an upside down world. A speculative frenzy fueled by extreme monetary policy is sending stock markets to all-time highs and bond yields and spreads to record lows. At the same time, a global recession is raging, and social unrest is worsening by the day. We shouldn’t forget a pandemic is still having a significant effect on our lives.
Maybe investors are just an optimistic bunch and able to look beyond the current problems. However, it could be that investors are again falling victim to greed and cannot see the forest for the trees. More bluntly, maybe they cannot see the risks for the hope.
Another consideration is that desperate times call for desperate measures. Despite no visibility into the future, investors are frantic to own anything offering a positive return with little regard for the embedded risk.
In this piece, we quantify the upside down world in which stock investors find themselves in. Does it make sense? Absolutely not, but as we will show, a strong understanding of market dynamics exposes some valuable gems. When the time comes, these stocks will make playing defense productive.
Market Cap Is All That Matters
The major stock indexes sit at record highs despite a large swath of underlying stocks plodding along. The gains are superficial, a mask of sorts, resulting from the outperformance of the largest companies.
The S&P 500 and NASDAQ are market-cap-weighted indexes, meaning the largest companies contribute more to the index than the smallest. To be specific, and as shown below, within the S&P 500, the largest 100 companies account for 72.77% of the index. The smallest 200 only accounts for 6.67%. If those smallest 200 stocks all went to zero tomorrow, the S&P 500 would only decline by 6.67%.
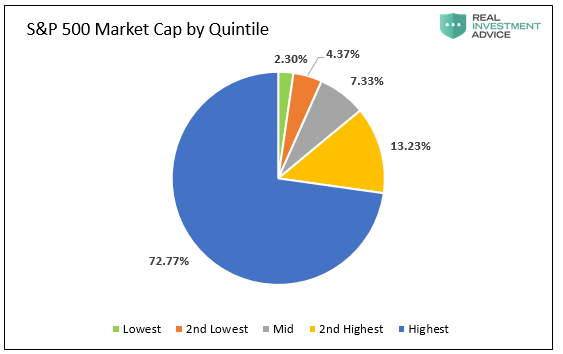
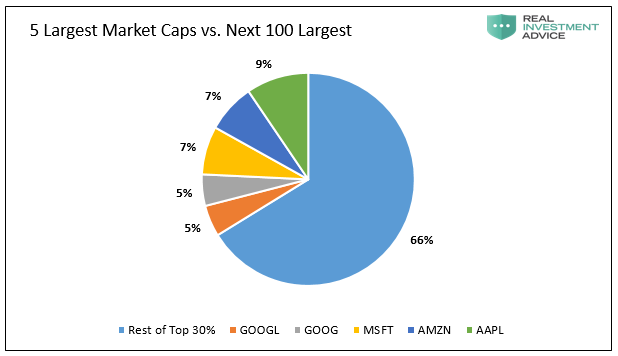
A closer look reveals that the problem is even more acute. Within the S&P 500 top 100 largest companies, the five biggest by market cap account for 33%. That is a stunning and unhealthy concentration.
Perspective Matters
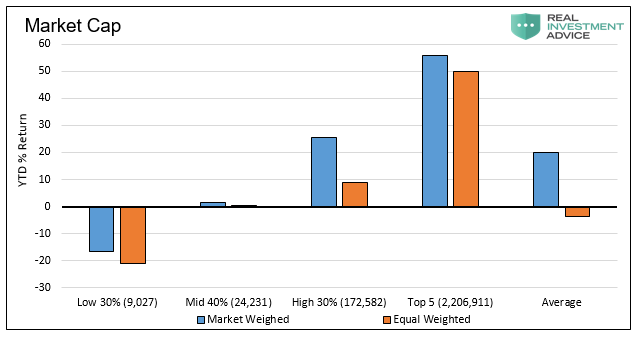
If we change perspective from index performance to a comprehensive accounting of the index constituents, we get a much different picture. One look at the chart below shows the gains are poorly distributed. The largest 30% of companies are where the gains are found.
If we strip out the five largest companies (AAPL, AMZN, MSFT, GOOG, and GOOGL) from the “highest 30%” grouping, the market-weighted gain falls from 25.56% to 10.23%.
*The S&P 500 return differs from the average, as shown below. This analysis uses current weightings and year to date returns, whereas the index uses daily weightings and returns.
Are the Largest and Best Performing Companies the Cheapest?
An initial glance at the data above may lead one to assume that the biggest companies are the most fundamentally sound. That would certainly explain why they are outperforming. If that is the case, price and financial fundamentals should rightfully be traveling in lockstep.
The graphs below highlight four widely followed measures of equity valuation. Each again contrasts the market cap-weighted and equal-weighted perspectives and the three market cap groupings (bottom 30%, mid 40%, and top 30%). We also separate the five most expensive companies for each valuation metric and the average valuation for each metric.
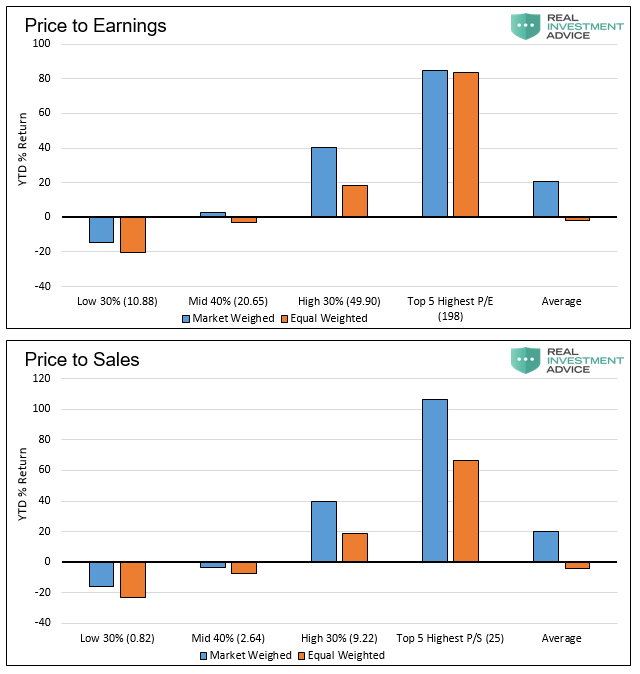
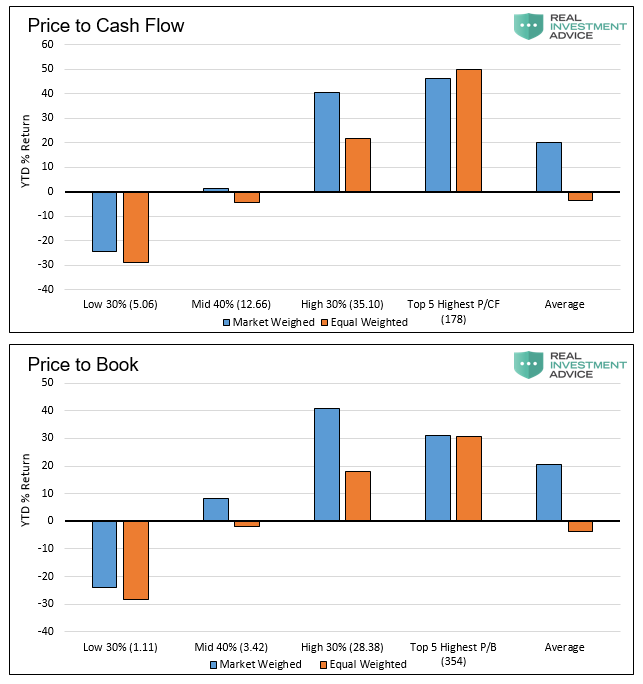
Contrary to what most would expect in a normal world of markets and valuation, the charts show YTD performance quite the opposite. The more expensive the stock groupings are, on average, the better their performance. Even more insane, the five companies with the most egregious valuations in each metric excelled.
Value is Dead, Long Live Value
Anyone can discuss the latest trend, but the best investors always look for the next trend. It is easy to restate the obvious and point out what happened; it is much harder to forecast what will happen.
This analysis shows the market is running on the strength of a few stocks while many stocks struggle. As this continues, opportunities emerge – opportunity in the form of companies whose stocks are going nowhere despite having cheap valuations.
CVS Health Corp (NYSE:CVS), for example, is one such company. The table below shows how CVS’s valuation stacks up against the S&P 500 and the top 30% by market cap.
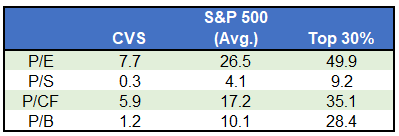
Over the last five years, CVS has grown earnings and revenue at an annualized rate of approximately 12%. That is three times the rate at which the S&P 500 has increased for each.
Despite the strong fundamentals, CVS is badly underperforming the S&P 500. The graph below shows CVS lags by over 25% this year.
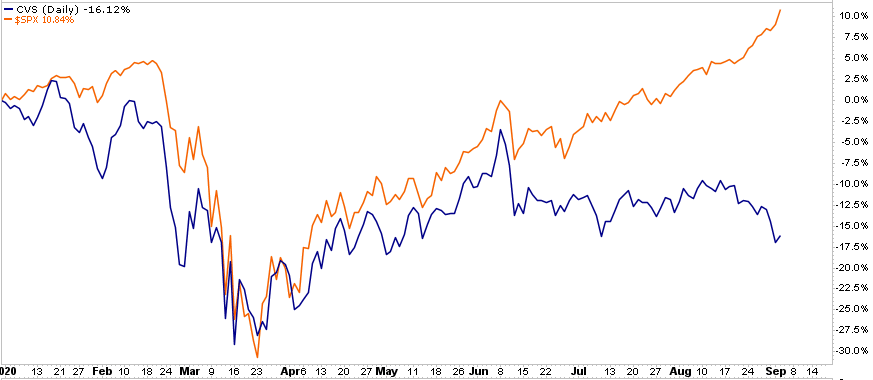
The passive investing phenomenon of indiscriminately chasing the popular stocks and the largest companies is leaving behind some gems. CVS is just one of many companies worth exploring.
Summary
The market valuations of the companies in which the media and investors focus the most attention are confounding. At the same time, there is little discussion about stocks like CVS, which offer significant relative value. Stocks where you can get a whole lot more for your money.
When the euphoria of the current environment ends, cheap companies have the potential not only to limit downside risk but also to provide healthy returns when the market comes to its senses.
