The S&P 500 and Dow have gone nowhere since March 1st. The SPX had been bumping its head on 2400 until Wednesday. The Dow and the SPX have been levitating on the backs of five tech stocks: Apple (NASDAQ:AAPL), Amazon.com (NASDAQ:AMZN), Facebook (NASDAQ:FB), Alphabet (NASDAQ:GOOGL)and Microsoft Corporation (NASDAQ:MSFT). AAPL alone is responsible for 25% of the Dow’s YTD gain and 13% of the SPX’s. Connected to this, the tech sector in general has bubbled up like Dutch Tulips in the mid-1630’s. The Nasdaq hit an all-time high (6,169) on Tuesday.
But, as this next chart shows, despite a handful of stocks trying to rain on the bears’ parade, there’s plenty of stocks that have been selling off:
The chart above shows the S&P 500 vs the Semiconductor Index SOX, Retail Index (NYSE:XRT), IBM (NYSE:IBM) and Ford Motor Company (NYSE:F)since the election. The SOX index was used to represent the tech sector. You can see that, similar to the culmination of the 1999-early 2000 stock bubble, the tech stocks are bubbling up like a geyser. IBM is a tech company but its operations are diversified enough to reflect the general business activity occurring across corporate America and in the overall economy.
The retail sector has been getting hit hard, reflecting the general decay in financials of the average middle class household. And Ford’s stock reflects the general deterioration in U.S. manufacturing and profitability. Anyone who believes that the unemployment rate is truly 4.4% and that the economy is doing well needs to explain the relative stock performance of the retail sector, IBM and F.
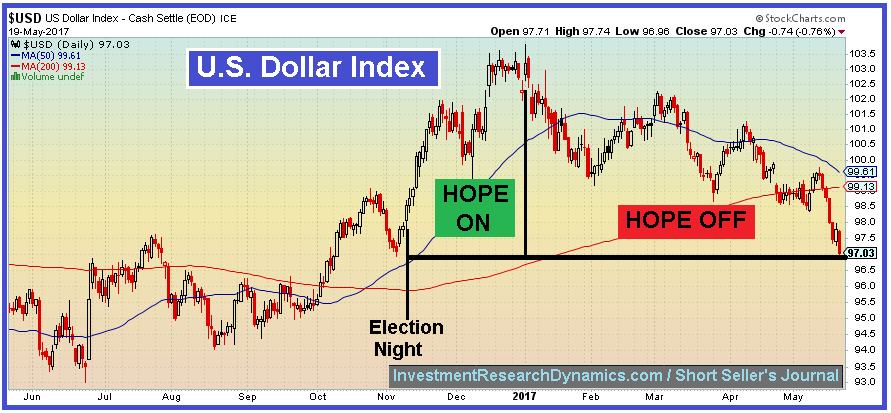
Despite the levitation of the SPX and Dow, the “hope helium” that has inflated the stock bubble since the election has been leaking out since January 1st. While many stocks in NYSE are either below their 200 dma or testing 52 week lows, the price action of the U.S. Dollar Index best reflects the inflation and deflation of the Trump “hope bubble:”

I’ve always looked at the U.S. dollar as a “stock” that represents the U.S. political, financial and economic system. As you can see, U.S.A.’s stock went parabolic after the election until December 31st. Since that time, it’s deflated back down to below its trading level on election day.
This has also been the fate of the average stock that trades on the NYSE. In fact, as of Friday’s close, 55% of the stocks on NYSE are below their 200 day moving average. Nearly 62% of all NYSE stocks are below their 50 dma. Just 4.37% of S&P 500 stocks are at 52-wk highs despite the fact that the SPX hit a new all-time high of 2402 on Tuesday. These statistics give you an idea of how narrow the move higher in the stock market has been, as the average stock in the NYSE/SPX/Dow indices is diverging negatively from the respective indices. The foundation of the stock market is crumbling.

