Getting ready for AMD earnings report
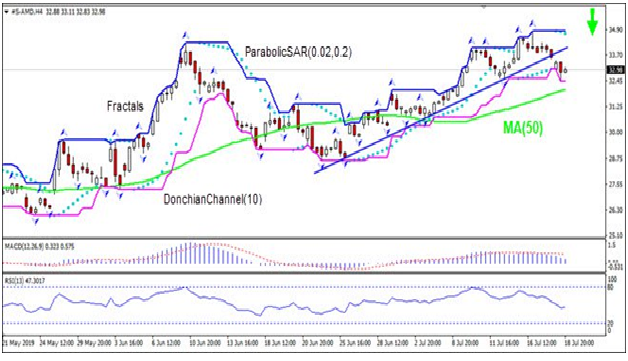
AMD stock has breached below support. Will the AMD price continue declining?
The Advanced Micro Devices (NASDAQ:AMD) is to report Q2 earnings on July 24. In May the U.S. Department of Energy announced that AMD and Cray (NASDAQ:CRAY) had been awarded a $600 million contract to develop the ‘Frontier’ supercomputer to be used for calculations in areas like nuclear and climate research. In Q3 AMD plans to start selling its 7-nanometer (nm) chips. With these smaller and more power-efficient chips, AMD is aiming to take market share from Intel (NASDAQ:INTC), especially in data center business. Intel’s 10nm chips which will not be sold until the end of the year. AMD expects its Q2 gross margin to be 41%, the highest in eight years on revenue about $1.52 billion, a decrease of approximately 13% YoY. Positive news have been priced in however: AMD price has risen over 90% year to date, and high volatility is likely before the earnings report, and any underperformance may result in steep declines.

On the 4-hour timeframe the S-AMD: H4 has breached below the support line, this is bearish.
- The Parabolic indicator has formed a sell signal.
- The Donchian channel indicates no trend: it is flat.
- The MACD indicator gives a bearish signal: it is above the signal line and the gap is narrowing.
- The RSI oscillator is falling but has not reached the oversold zone.
We believe the bearish momentum will continue after the price breaches below the lower Donchian boundary at 32.42. This level can be used as an entry point for placing a pending order to sell. The stop loss can be placed above the fractal high at 34.85. After placing the order, the stop loss is to be moved every day to the next fractal high, following Parabolic signals. Thus, we are changing the expected profit/loss ratio to the breakeven point. If the price meets the stop loss level (34.85) without reaching the order (32.42), we recommend cancelling the order: the market has undergone internal changes which were not taken into account.
Technical Analysis Summary
Position Sell Sell stop Below 32.42 Stop loss Above 34.85Market Overview
Stocks snap back-to-back skid as Williams (NYSE:WMB) supports for preemptive rate cuts
Dollar weakening accelerated after Williams’ comments
US stock market rebounded on Thursday as New York Fed President John Williams said the most effective strategy for the Federal Reserve is to cut rates at the first sign of trouble with benchmark interest rate so close to zero. The S&P 500 gained 0.4% to 2995.11. The Dow Jones industrial average edged up 0.01% to 27222.97. Nasdaq composite index rose 0.3% to 8207.24. The dollar weakening accelerated as traders interpreted Williams’ comments as support for a half-point rate cut at the Fed’s next policy meeting on July 30-31: the live dollar index data show the ICE (NYSE:ICE) US Dollar index, a measure of the dollar’s strength against a basket of six rival currencies, fell 0.5% to 96.70 but is higher currently. Stock index futures point to higher market openings today
DAX 30 leads European indexes slump
European stocks extended losses on Thursday led by 5.6% drop in SAP share after Europe’s most valuable tech company’s disappointing quarterly results. Both EUR/USD and GBP/USD accelerated their climb with both pairs lower currently. The Stoxx Europe 600 index ended 0.2% lower. Germany’s DAX 30 lost 0.9% to 12227.85. France’s CAC 40 fell 0.8% and UK’s FTSE 100 slid 0.6% to 7493.09 despite a report of unexpected 0.1% on month rise in UK retail sales for June.
Nikkei leads Asian indexes recovery
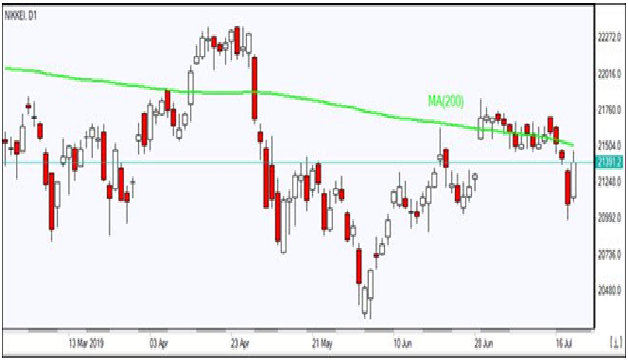
Asian stock indices rebounded today after a recovery on Wall Street overnight. Nikkei rose 2% to 21466.99 as yen resumed its slide against the dollar. Chinese shares are gaining despite reports trade negotiations between the U.S. and China had faltered over restrictions on Chinese telecommunications giant Huawei: the Shanghai Composite Index is up 0.8% and Hong Kong’s Hang Seng Index is 1.1% higher. Australia’s All Ordinaries Index turned 0.8% higher as Australian dollar resumed its slide against the greenback.

Brent up
Brent futures prices are edging higher today after a U.S. Navy ship destroyed an Iranian drone in the Strait of Hormuz. Prices fell yesterday: September Brent crude lost 2.7% to $61.93 a barrel on Thursday.
