Lower world wheat ending stock estimate bullish for wheat
Wheat ending stock estimate was lowered in WASDE July report. Will the wheat prices continue rebounding?
Wheat prices are under pressure as harvest gets closer for spring wheat. The US Department of Agriculture revised downward world wheat ending stocks for 2019/20 from previous estimate of 292.43 million metric tons (MMT) to 286.46 MMT in this month’s World Agricultural Supply and Demand Estimates (WASDE) report. Lower wheat ending stock estimate is bullish for wheat. However, USDA upgraded its US all-wheat production estimates from 1.903 billion bushels in June to 1.921 billion bushels due to an increase in winter wheat attributed to better yields. Higher US wheat production is a downside risk for wheat.

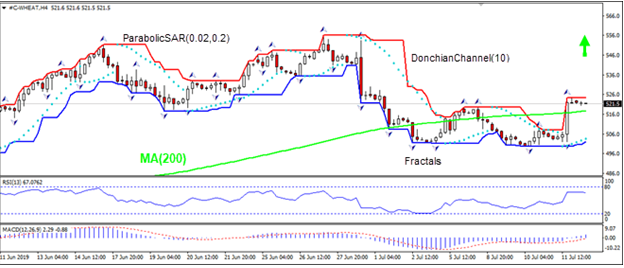
On the 4-hour timeframe the WEHAT: H4 has risen above the 200-period moving average MA(200), this is bullish.
- The Parabolic indicator gives a buy signal.
- The Donchian channel indicates uptrend: it is narrowing up.
- The MACD indicator gives a bullish signal: it is above the signal line and the gap is widening.
- The RSI oscillator has levelled off and has not reached the oversbought zone yet.
We believe the bullish momentum will continue after the price breaches above the upper boundary of Donchian channel at 524.3. This level can be used as an entry point for placing a pending order to buy. The stop loss can be placed below the last fractal low at 502.0. After placing the order, the stop loss is to be moved every day to the next fractal low, following Parabolic signals. Thus, we are changing the expected profit/loss ratio to the breakeven point. If the price meets the stop loss level (502.0) without reaching the order (524.3), we recommend cancelling the order: the market has undergone internal changes which were not taken into account.
Technical Analysis Summary
Order Buy Buy stop Above 524.3 Stop loss Below 502.0Market Overview
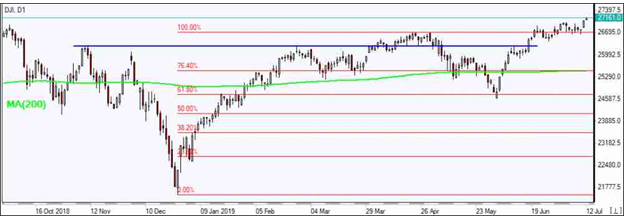
Dow, SP 500 post record closes Dollar weakens as inflation slowsUS stock market rebound accelerated on Thursday as Powel reasserted Federal Reserve’s inclination to ease monetary policy against the background of lingering risks to global growth such as US-China trade dispute. The S&P 500 gained 0.2% to fresh record 2999.91. The Dow Jones industrial average rose 0.9% to new record 27088.08. Nasdaq composite index however slipped 0.1% to 8196.04. The dollar weakening continued as consumer price inflation fell to 1.6% from 1.8% in April: the live dollar index data show the ICE (NYSE:ICE) US Dollar index, a measure of the dollar’s strength against a basket of six rival currencies, slipped 0.03% to 97.07 and is lower currently. Stock index futures point to higher market openings today

European stocks slide continued on Thursday after the International Monetary Fund called for fresh stimulus from the ECB. EUR/USD inched down while GBP/USD continued its slide with both pairs higher currently. The Stoxx Europe 600 index ended 0.1% lower. Germany’s DAX 30 lost 0.3% to 12332.12. France’s CAC 40 slipped 0.3% and UK’s FTSE 100 slid 0.3% to 7501.82.
Shanghai Composite leads Asian indexesAsian stock indices are mostly rising today. Nikkei rose 0.2% to 21685.90 despite yen's resumed climb against the dollar. Chinese shares are gaining despite President Trump’s tweet on Thursday China was not living up to promises it made on buying US agricultural products: the Shanghai Composite Index is up 0.4% and Hong Kong’s Hang Seng Index is 0.2% higher. Australia’s All Ordinaries Index however slid 0.3% as Australian dollar accelerated its climb against the greenback.
Brent up as Tropical Storm Barry advancesBrent futures prices are edging higher today with half US Gulf Coast oil output shut down because of Tropical Storm Barry. Prices fell yesterday: September Brent crude lost 0.7% to $66.52 a barrel on Thursday.
