Lower Canadian Crop Estimate Bullish For Wheat
Wheat production estimate was lowered in Canada’s Principal field crop areas report. Will the wheat prices continue rising?
Statistics Canada reported wheat plantings at 24.595 million acres on June 26, down 0.6% from 2018. This area is below a prior estimate of 25-26 million acres. Canada is world’s seventh top wheat producer, and what is more important the second biggest wheat exporter: Canada exported $5.7 billion worth of wheat during 2018, accounting for 14.2% of global wheat exports in 2018. Lower Canadian wheat production estimate is bullish for wheat.

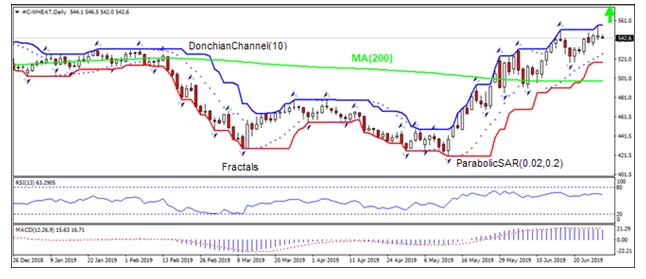
On the daily timeframe the WEHAT: D1 is above the 200-day moving average MA(200), this is bullish.
- The Parabolic indicator gives a buy signal.
- The Donchian channel indicates no trend yet: it is flat.
- The MACD indicator gives a bearish signal: it is above the signal line and the gap is narrowing.
- The RSI oscillator has levelled off and has not reached the oversold zone yet.
We believe the bullish momentum will continue after the price breaches above the upper boundary of Donchian channel at 556.1. This level can be used as an entry point for placing a pending order to buy. The stop loss can be placed below the last fractal low at 517.5. After placing the order, the stop loss is to be moved every day to the next fractal low, following Parabolic signals. Thus, we are changing the expected profit/loss ratio to the breakeven point. If the price meets the stop loss level (517.5) without reaching the order (556.1), we recommend cancelling the order: the market has undergone internal changes which were not taken into account.
Technical Analysis Summary
| Order | Buy |
| Buy stop | Above 556.1 |
| Stop loss | Below 517.5 |
Market Overview
S&P 500 snaps four-day losing streak
Dollar Strengthening Accelerated On GDP Final Reading
US stock market edged higher on Thursday ahead of G20 summit despite National Economic Council director Larry Kudlow’s comment US may move forward with additional tariffs, and no preconditions were set ahead of Trump’s meeting with Xi. The S&P 500 gained 0.4% snapping four-day retreat. The Dow Jones Industrial average however slipped less thane 0.1% to 26526.58. Nasdaq composite index rose 0.7% to 7967.76. The dollar strengthening accelerated as the final revision of first quarter GDP confirmed the US economy grew at a solid rate of 3.1% in the first quarter. The live dollar index data show the USD index, a measure of the dollar’s strength against a basket of six rival currencies, added 0.05% to 96.21 but is lower currently. Futures on US stock indices point to higher openings today.
DAX 30 gained while other European indexes slip
European stocks ended unchanged on Thursday. Both EUR/USD and GBP/USD turned lower with both pairs higher currently. The Stoxx Europe 600 index ended flat. Germany’s DAX 30 however rose 0.2% to 12271.03 lifted by 8.7% rally in Bayer (DE:BAYGN). France’s CAC 40 slipped 0.1% and UK’s FTSE 100 slid 0.2% to 7402.33.

Australia’s All Ordinaries Index leads Asian indexes declines
Asian stock indices are mostly lower today while Trump met with the leaders of Japan, Germany and India on the sidelines of the G20 meeting in Osaka, Japan. Nikkei fell 0.3% to 21275.92 as yen reversed its earlier slide against the dollar. Chinese shares are retreating with no certainty about the outcome of Trump and Xi meeting tomorrow after the American president's statement earlier he was preparing to target the $300 billion Chinese imports : the Shanghai Composite Index is down 0.6% while Hong Kong’s Hang Seng Index is 0.3% lower. Australia’s ASX All Ordinaries turned 0.7% lower with Australian dollar’s climb against the greenback intact.
Brent Down
Brent futures prices are edging lower today. Prices inched up yesterday: August Brent crude ticked up 0.1% to $66.55 a barrel on Thursday.
