Well, folks, it’s time to check the major market indexes and see what’s what. I’d say at this point, the entire globe is covered with bear carcasses, and I see no logical reason left why the market should go do again. Ever. Because if you throw $120 billion of cash every month at this thing, why shouldn’t Dow 100,000 be just around the corner? Seriously.
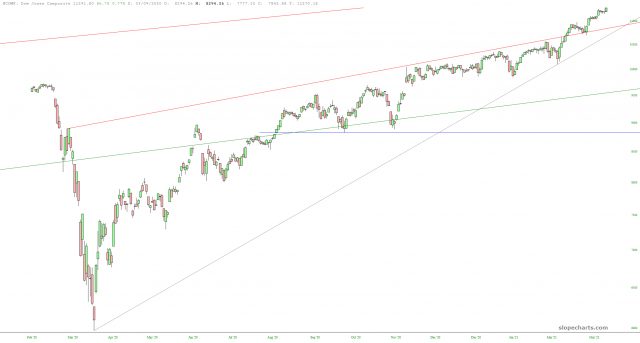
So we start with the Dow Jones Composite which has blown past any boundary of its wedge and, like almost everything else, is simply celebrating each new weekday with a price level never witnessed in human history.
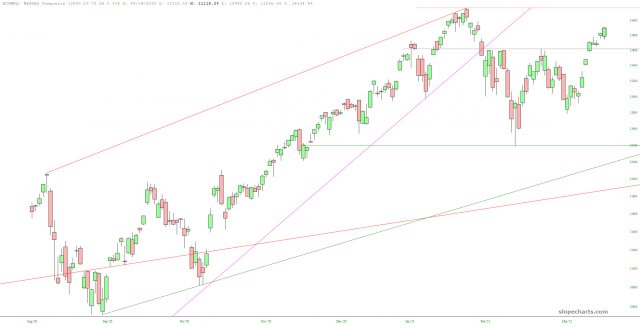
The NASDAQ Composite is not at a lifetime high, but by God, it’s close (and with goddamned Powell making yet another 60 Minutes vanity spot on Sunday evening, he might blather out some words which vault it right across the finish line).
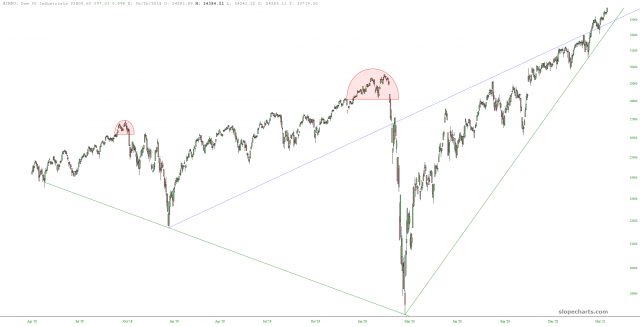
This Dow Industrials has, over the past few years, had a whole series of ups and downs, although the most recent “up” is clearly its most interminable.
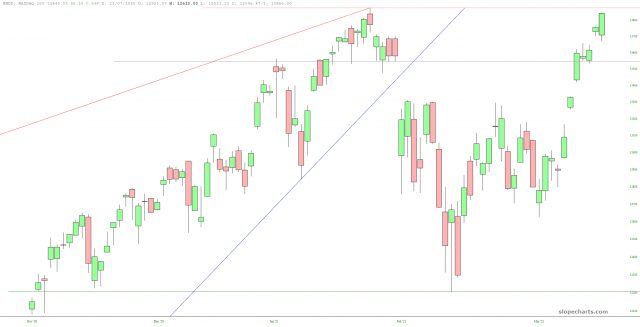
Like the Composite, the NASDAQ 100 is not at a lifetime high, but it’s extraordinarily close; even a tiny “up” day Monday would do the deed.
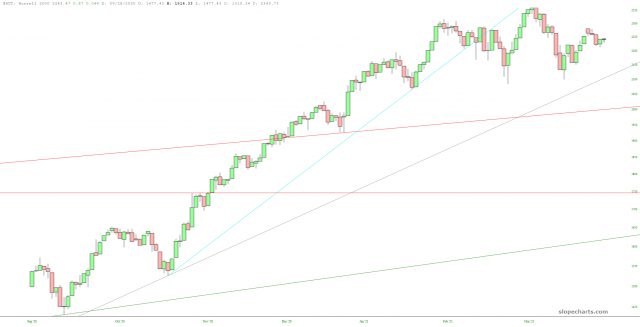
Perhaps the most blasé index, the Russell 2000, which is the small caps, has been meandering for two solid months. Here we see the index pretty much unchanged since then, as it sine waves its way around.
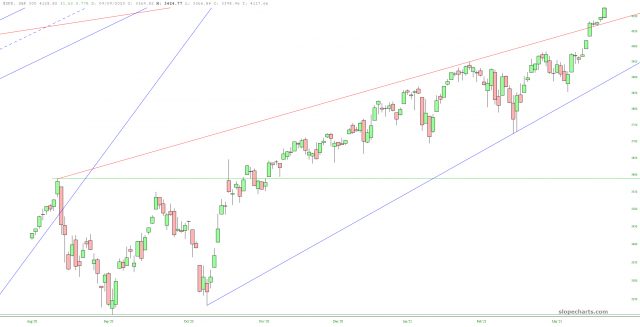
The S&P 500 is sporting a well-defined wedge, which it has ripped above with some gusto.
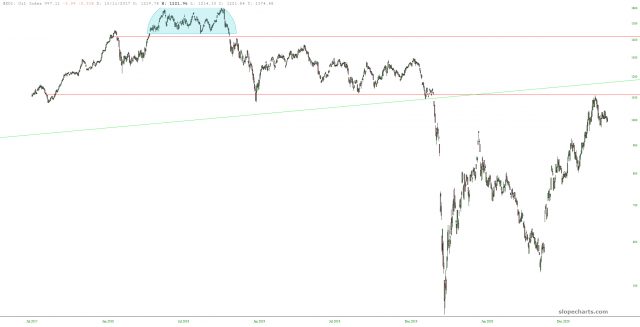
The last bastion of any weakness at all is the Oil and Gas Index, which has a legitimate chance of having its own private, personal bear market. Perhaps this is the last honest representation of the actual economic prospects facing the world economy.
Rationality, traditional business metrics, and common sense have all been thrown into the meat grinder, people. The devil rules the roost now. The day will come when intelligence, discernment, and wisdom will thrive once more. What stands between us and that day—the events to compel such a transformation—becomes more dreadful with every passing week.
