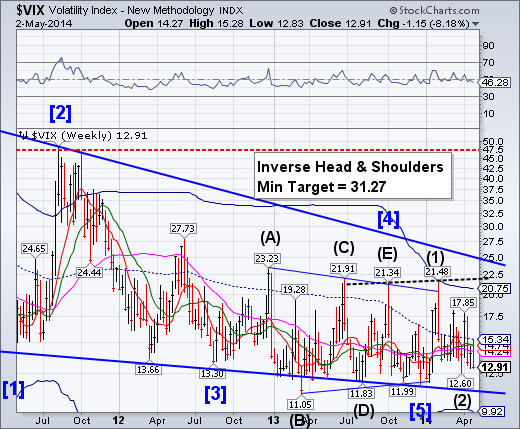
VIX tested weekly mid-Cycle resistance at 15.34 before falling back toward the lows. A Minor Wave 2 low may have been put in. There is still a sense of complacency among investors that may be unwarranted.
SPX fails to make a new high

S&P 500 probed higher this week in an attempt to make new highs, which it did not. SPX closed up this week, but merely retraced losses from the previous week. The lower top implies a bearish outcome, since the last reversal in an Orthodox Broadening Top usually is at the upper trendline. The next support appears to be at 1740.00, its 14-year Top trendline.
ZeroHedge: There is an old Wall Street axiom that goes "Sell in May and go away, come again after St. Leger's day." Of course, as with all Wall Street axioms, they are viewed by the media to be "valid" only if they work every single year. The reality is that no axiom, investment discipline or strategy works all the time. It is the cumulative effect over long periods of time which defines success or failure.
NDX rallies, stops at double resistance
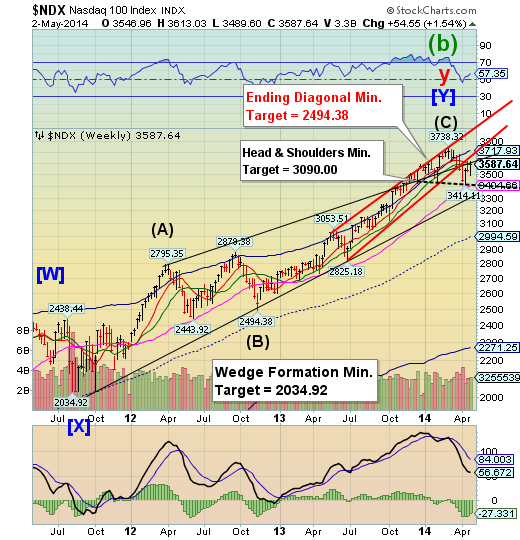
NDX attempted yet another rally that was repelled at the upper trendline of the Wedge formation and both weekly Short-term resistance at 3589.34 and Intermediate-term resistance at 3588.33. It now appears to be preparing to test the Head & Shoulders neckline at 3405.00. The equities Cycle just had a Primary Cycle top on Friday and may see a reversal as early as Monday.
( Having called for the demise of the hype/hope growth stocks, biotech, and social media schemes at the end of 2013, Marc Faber believes the weakness in those sectors is a signal of things to come (and that the so-called "rotation" to quality stocks is fallacious in the medium-term). Faber carefully notes that the size of markets allows some stocks to move up as others move down and so the overall market "looks" ok, but warns "we have already had a big break in parts of the market... but we haven't had the big break in the overall market," adding that "it's too late to buy the US stock market
The Euro makes a weaker test of the wedge
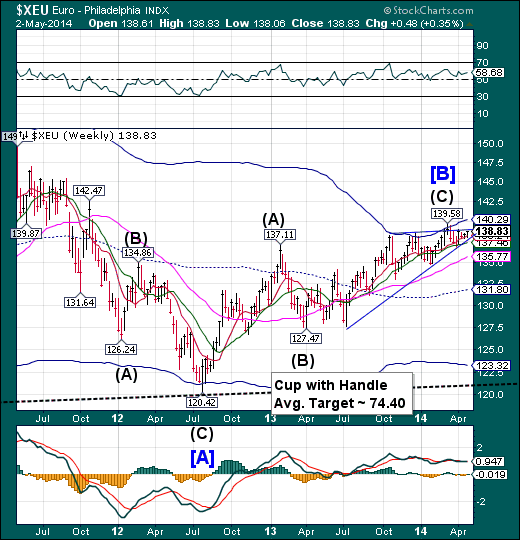
The Euro completed a third “inside” week within its Ending Diagonal, challenging its April 11 (secondary) high at 139.11, without success. As the lower trendline of the Ending Diagonal rises, there is less wriggle room in the Diagonal. A break of the lower trendline signals that the decline back to the Lip of its Cup with Handle formation at 121.00 has begun.
Reuters: French Prime Minister Manuel Valls said on Saturday the euro was too strong and that President Francois Hollande would take initiatives to boost growth and employment after the May 22-25 European elections.
"We need a more appropriate monetary policy, because the level of the euro is too high. We need a major change that makes our monetary policy a tool![]() for growth and job creation, a tool that serves the people," Valls said at a meeting of young European socialists close Paris.
for growth and job creation, a tool that serves the people," Valls said at a meeting of young European socialists close Paris.
"With that purpose in mind, the president of the republic will take initiatives after the European elections," Valls added, reiterating comments he made this week.
EURO STOXX may have completed a reversal pattern
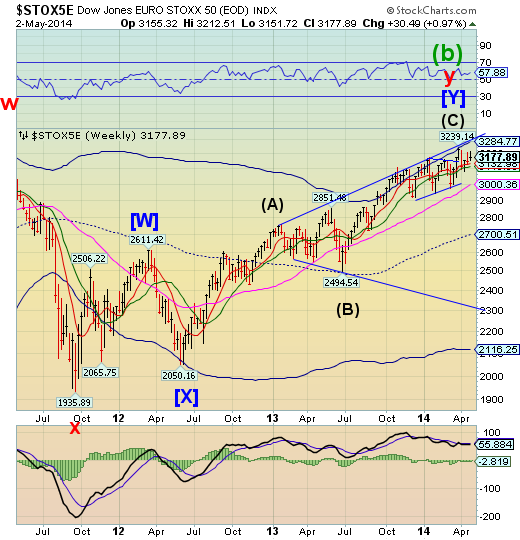
The EuroStoxx 50 index challenged its high at 3239.14 for a second week and failed. Failing to make a new high makes the new Master Cycle left-translated and bearish.
BusinessWeek: The North Atlantic Treaty Organization has ranged as far abroad as Afghanistan and Iraq in recent years. Now the crisis in Ukraine is pulling it back to the mission that led to its creation 65 years ago: defending Europe’s eastern rim against Kremlin expansionism.
The U.S., Britain, and some other NATO members began deploying troops and fighter jets to Poland and the Baltics last month. Now leaders of these and other central and eastern European countries, which joined the alliance after the fall of the Soviet Union, are asking for even more support. The prime minister of Latvia, which borders Russia, this week said she’d like to have a permanent U.S. military base there.
The Yen continues its sideways consolidation
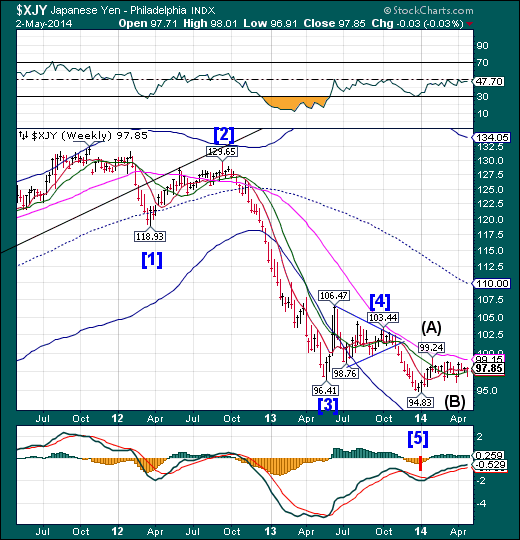
The yen challenged, then closed above both weekly Short-term and Intermediate-term resistance this week. This may resolve the three-month-long sideways consolidation, which is a coiling action that often results in a continuation of the move preceding it. Should traders start to view the Yen as a safe haven during political and economic turmoil, the money flow may reverse course and move from stocks to currencies like the Yen.
MarketWatch: The dollar fell broadly on Wednesday after data showed the U.S. economy barely grew in the first quarter, in part due to harsh winter weather, suggesting that the Federal Reserve could be inclined to keep interest rates low well after the end of its stimulative bond purchases.
The dollar USD/JPY -0.1361% fell to ¥102.22 from ¥102.63 late Tuesday. For the month, the dollar has lost 1% against the yen.
The Nikkei 225 remains above its Head & Shoulders neckline
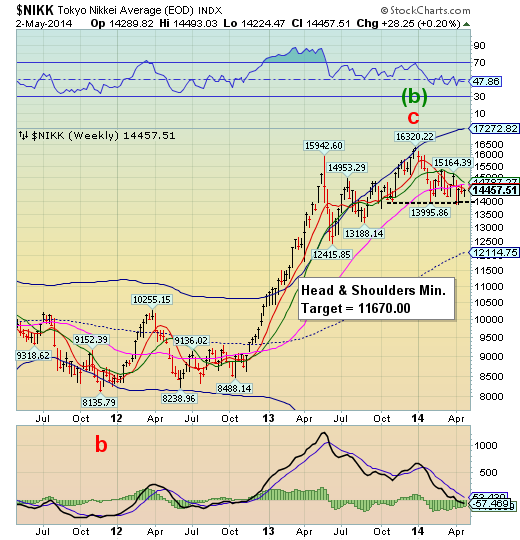
The Nikkei remained beneath all of its potential supports except the neckline of its Head & Shoulders formation on Friday. Lower highs and lower lows are an indication that liquidity is exiting the markets. A rally in the Yen may accompany a further decline in the Nikkei.
JapanTimes: The benchmark Nikkei average retreated slightly on the Tokyo Stock Exchange on Friday, hit by selling to lock in profits after the previous day’s surge.
The Nikkei 225 average ended down 27.62 points, or 0.19 percent, at 14,457.51. But the Topix recouped earlier losses to end up 0.28 point, or 0.02 percent, at 1,182.48, after gaining 19.76 points the previous day.
US Dollar I is still near its Cyclical lows
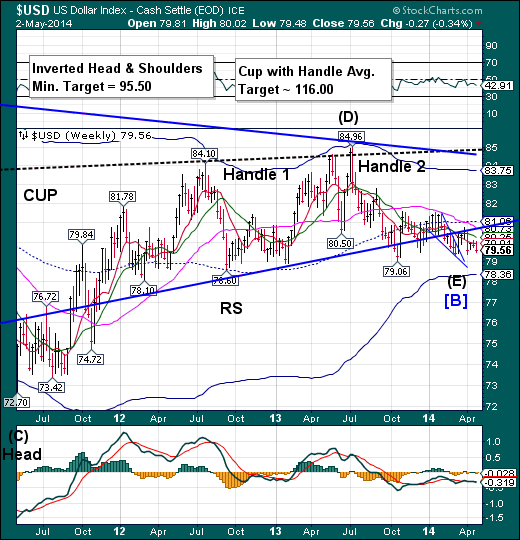
The Dollar continues to tarry near its lows. It has made a Trading Cycle low on May 1which suggests a rally may be imminent. The significance of this may be a full trading Cycle may result in a rally lasting up to two months. A challenge of, or a breakout above, mid-Cycle resistance at 81.06 will confirm a probable new uptrend.
The dollar declined against most major counterparts amid heightened tensions in Ukraine and employment data that sent mixed signals on the strength of the U.S. expansion following a first-quarter slowdown.
The greenback initially reached a six-week high against a basket of peers after the Labor Department said employers boosted payrolls in April by the largest amount in two years and the jobless rate plunged. At the same time, the share of the working-age population either employed or seeking a job declined. A measure of market volatility rose from almost a seven-year low.
Treasuries at the end of a retracement?
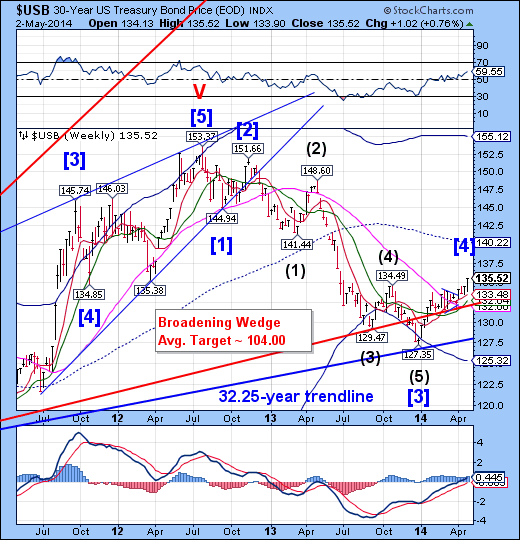
Treasuries extended their retracement to make a Trading Cycle high on Friday. It has exceeded its daily resistance near 135.00 (not shown). USB has a date with a major Cycle bottom near the end of May. The rally may be a bull trap.
Bloomberg: Treasury bonds rose, pushing yields to a 10-month low, as investors looked past a report showing the U.S. added more jobs than forecast last month and sought a refuge from escalating tensions in Ukraine.
Yields on the longest-maturity U.S. government security swung more than 10 basis points after initially rising after a government report showed the economy added the most jobs last month since 2012. Shorter-maturity debt remained lower as investors bet the strengthening U.S. economy will convince the Federal Reserve to raise borrowing rates from historic lows. The gap between yields of five- and 30-year debt, known as the yield curve, narrowed to the least since 2009 as traders moved forward bets on the date next year when the central bank may increase interest rates.
Gold fails at making a second attempt at resistance
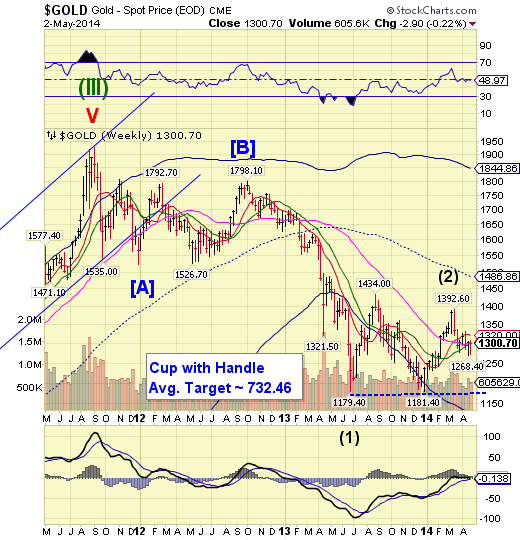
Gold appears to have made a final attempt at overcoming Long-term resistance at 1301.71 and did not succeed. Unfortunately, this failure to thrive is not good for the bulls. It appears that the decline may impose itself again early next week, whether gold makes its target or not.
ZeroHedge:Three months ago, we discussed the increasingly close eye that regulators were keeping on Deutsche Bank (and in fact many other precious metal fix providers) as manipulation concerns shifted from conspiracy theory to conspiracy fact. At the time, Deutsche - among other banks - had suggested it would relinquish its role on the London Fixing committee and was actively marketing its seat to other LBMA members - it failed to find a willing buyer; the WSJ now confirms.
Crude loses support
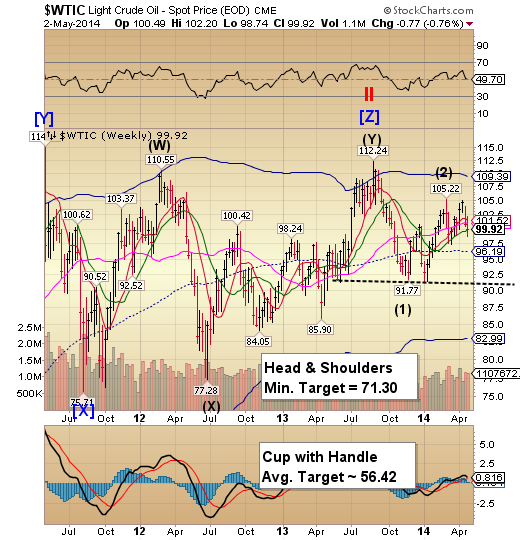
Crude has lost its Intermediate-term support at 99.97 this week. It also created a left-translated Trading Cycle, which is bearish, as suggested two weeks ago. As supports are eliminated, the decline may now gain momentum. The Cycles Model suggests that the decline may last through mid-May. The question is, how much damage will it do over the next week or two?
Barrons: Here's a puzzle: The U.S. is producing the most crude oil in decades, domestic stockpiles are at record highs, yet oil prices are near $100 barrel. What's keeping prices aloft?
The first piece of the puzzle is the way the U.S. prices its oil. The U.S. benchmark, known as West Texas Intermediate, or WTI, is based on delivery at a storage hub in Cushing, Okla. How much oil is stored in Cushing affects the price. At the moment, inventories of oil across the U.S. are at their highest going back to 1982, but Cushing has seen a steady drop since a new pipeline linking the hub to refineries along the Gulf Coast opened earlier this year.
The Cushing hub is "running on fumes," according to Société Générale, giving the appearance of tight supplies, and leading prices higher.
Shanghai Composite gingerly approaches its neckline
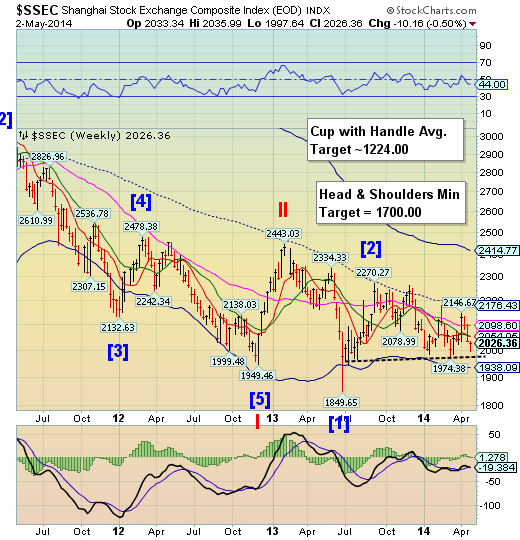
The Shanghai Index is approaching the neckline of its Head & Shoulders formation and temporarily using it as support. The new Trading Cycle has another week to make a Trading Cycle low. If the neckline fails as support this week, the ensuing decline may be swift and deep. There is no support beneath its Cycle Bottom at 1938.09.
HuffPost: China has rejected a World Bank report that suggests it might pass the United States this year to become the biggest economy measured by its currency's purchasing power.
China is on track to become the No. 1 economy by sheer size by the early 2020s and possibly sooner. But its leaders downplay such comparisons, possibly to avert pressure to take on financial obligations or make concessions on trade or climate change.
The estimate by the World Bank's International Comparison Program says that based on 2011 prices, the purchasing power of China's currency, the yuan, was much stronger than was reflected by exchange rates.
The Banking Index tests ong-term support
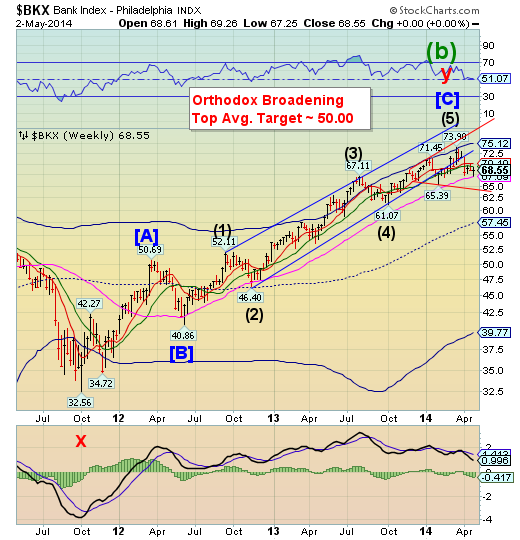
--BKX tested Long-term support at 67.09 this week and hit its lowest point since February 4. The next target is below its Orthodox Broadening formation near 62.75. A bounce from beneath the Broadening Top may heighten the probability of a flash crash soon after.
ZeroHedge: "The crisis doesn't destroy wealth, it merely evidences the extent to which wealth has already been destroyed by stupid investments made in the boom." This is critically important, as banking (or financial) crisis do not start the day the market collapses but years before, and as Punk Economics' David McWilliams explains, this is usually driven by banks (central or otherwise) beginning to lend recklessly using other people's money to ramp up asset values. So, with that in mind, what have we learned from the 2008 banking crisis? (spoiler alert - nothing good).
ZeroHedge: Another day, another preannouncement by a major bank confirming that the housing bubble has not only popped but that traditional bank activity, namely the lending of mortgage loans to consumers - who aren't borrowing not because they have no access to the loans but because real estate prices pushed up by institutional investors who don't need mortgage loans, are simply idiotic - is dead and buried.
ZeroHedge: As U.S. Justice Department prosecutors begin to bring the first criminal charges against global banks since the financial crisis, they are facing dire warnings of uncontainable collateral damage from none other than the sell-side's banking analysts... "Don’t play with matches," warned Brad Hintz, bringing up the specter of Enron (somehow suggesting we would better if that had not been prosecuted?) “The mere threat of requiring a hearing could cause customers to lose confidence in the institution and could cause a run on the bank,” warns a banking lawyer (well isn't that how it's supposed to be?). Too Big To Prosecute is starting to tarnish a little as Preet Bharara begins to bring the heat, adding, somewhat humorously that, banks have a "powerful incentive to make prosecutors believe that death or dire consequences await."
ZeroHedge: Reflecting on the divergence between equities at all time-highs and drastically sliding bond yields, CNBC's Rick Santelli reminds that it seems bonds recognize that business cycles work in "fits and starts" and not in straight-lines as some (equity bulls) would believe and reminds (as we noted previously) that with revisions, Q1 GDP could be negative. His discussion moves from US Treasury 'cheapness' relative to global bonds and the 'weather' effect's over-exuberant expectations; but it is his final topic that raised an eyebrow or two. Santelli doesn't buy into the meme that "the reason the Fed is doing all this is because Congress does nothing;" in fact, he exhorts, it's the opposite, if the Fed wasn't hunkered down supporting the stock market - and stocks started throwing little hissy fits (a la TARP), it would send signals... and things would get done!"
Disclaimer: Nothing in this email should be construed as a personal recommendation to buy, hold or sell short any security. The Practical Investor, LLC (TPI) may provide a status report of certain indexes or their proxies using a proprietary model. At no time shall a reader be justified in inferring that personal investment advice is intended. Investing carries certain risks of losses and leveraged products and futures may be especially volatile. Information provided by TPI is expressed in good faith, but is not guaranteed. A perfect market service does not exist. Long-term success in the market demands recognition that error and uncertainty are a part of any effort to assess the probable outcome of any given investment. Please consult your financial advisor to explain all risks before making any investment decision. It is not possible to invest in any index.
