Sellers Step Up The Pace

Published 10/25/2018, 12:25 AM
Updated 07/09/2023, 06:31 AM
NDX
-
US500
-
US2000
-
IXIC
-
SOX
-

Yesterday it was 2001 all over again, as lead indices registered 3% losses on a day of solid selling and registered distribution. The 'bear flags' are history but their effects are still very much in effect.

Worst affected was the Semiconductor Index as it gave up nearly 7% in a move which has the makings of a measured move lower. The initial target is 1,115 which doesn't look entirely unreasonable after yesterday. There was nothing bullish as relative performance (vs the NASDAQ 100) accelerated lower.
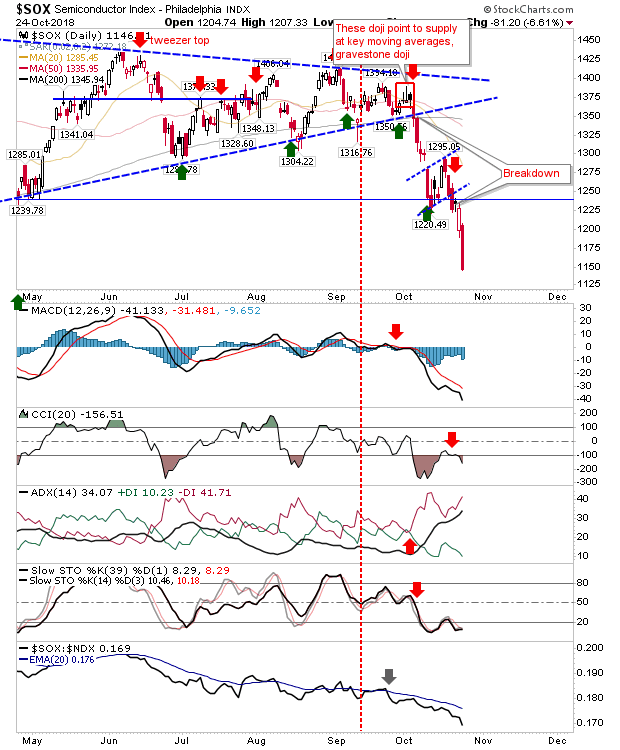
SOX Daily Chart

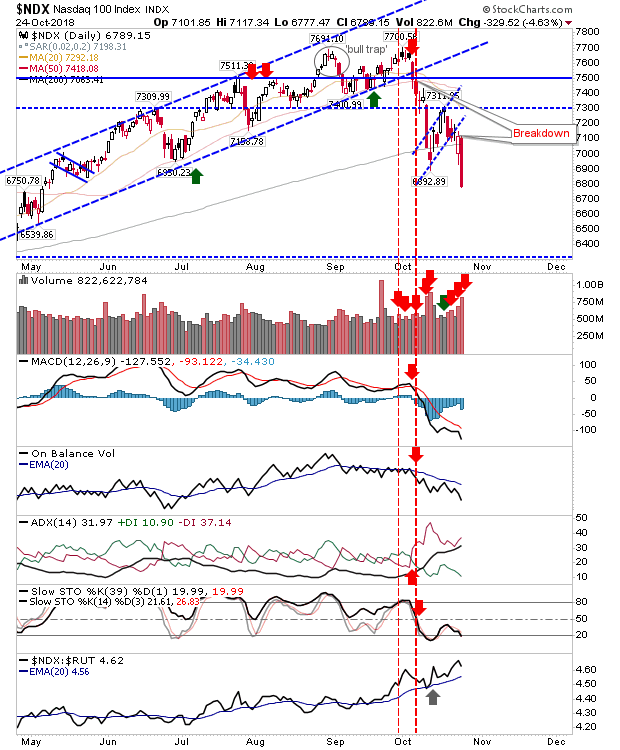
The patient got their rewards from the NASDAQ and NASDAQ 100 as 'bear flags' managed a belated break—but a break nevertheless. The NASDAQ maintained its sustained relative loss against the S&P as the ROC looks to lose the zero line (confirming the bear signal) thereby entering bearish territory. Measured move targets of 6,800 for the NASDAQ and 6,700 for the NASDAQ 100.
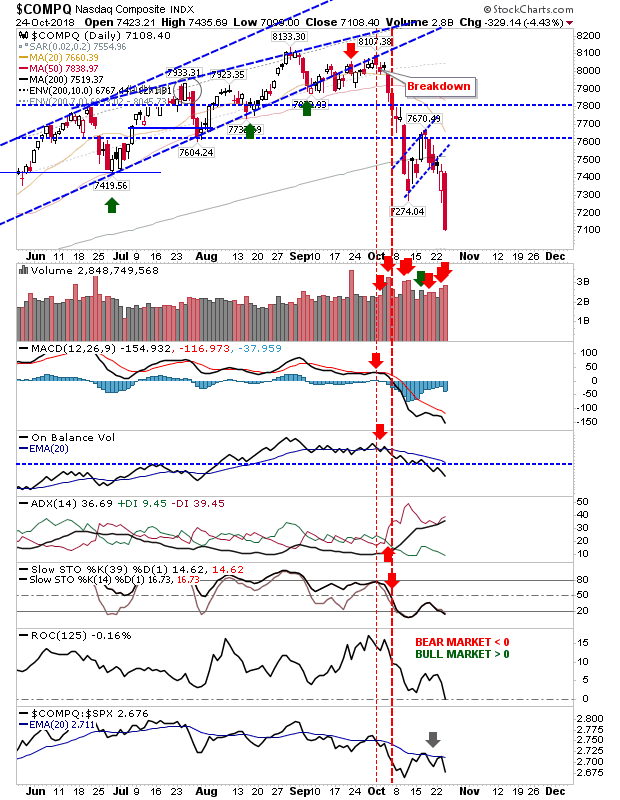
COMPQ Daily Chart
NDX Daily Chart

The Russell 2000 remains on course to reach the measured move target of 1,390
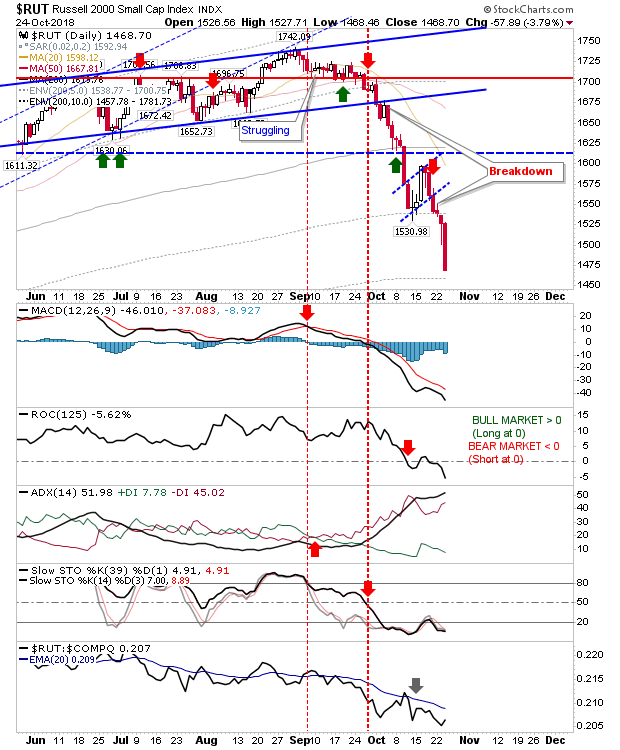
RUT Daily Chart

The S&P has a measured move target of 2,585 and has a good chance of making it there.
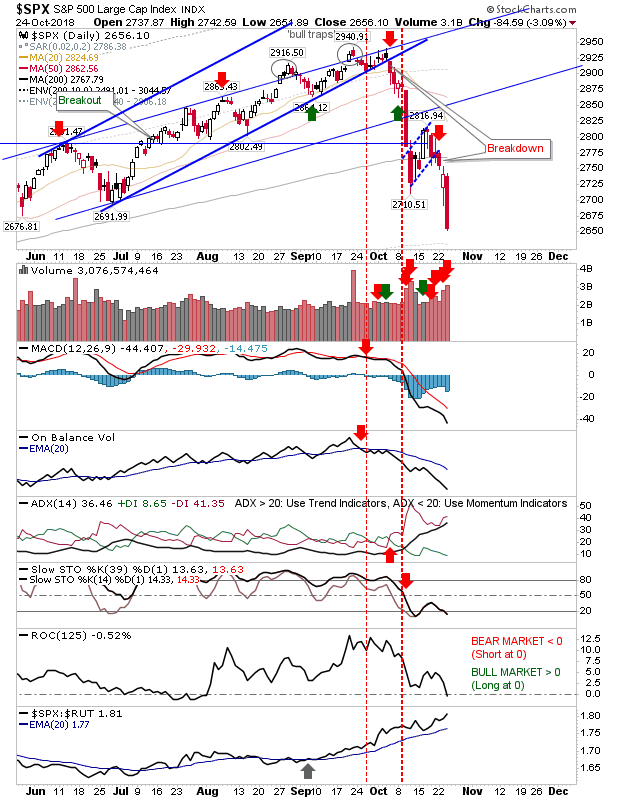
SPX Daily Chart

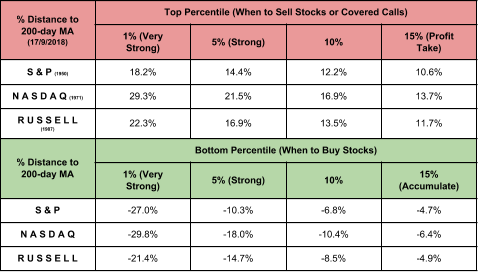
The targets we are now looking for are offered in the table below. Investors can look to buy when the relationship of the indices to their 200-day MAs reach the levels detailed below.

It should be noted, the S&P has entered the 15% zone marked for accumulation and the Russell 2000 is in the 10% zone. The NASDAQ hasn't yet reached the first zone. Such buying opportunities are rare - the last such time coming in 2016.

% Distance to 200-DMA

Investors should feel confident in taking advantage of putting money to work here and to continue to do so should prices fall further. The key thing is not to put all your money to work at this time, but to spread the buying opportunities across a 12 month period to maximize the opportunity weakness offers.

Latest comments

Loading next article…
Risk Disclosure: Trading in financial instruments and/or cryptocurrencies involves high risks including the risk of losing some, or all, of your investment amount, and may not be suitable for all investors. Prices of cryptocurrencies are extremely volatile and may be affected by external factors such as financial, regulatory or political events. Trading on margin increases the financial risks.
Before deciding to trade in financial instrument or cryptocurrencies you should be fully informed of the risks and costs associated with trading the financial markets, carefully consider your investment objectives, level of experience, and risk appetite, and seek professional advice where needed.
Fusion Media would like to remind you that the data contained in this website is not necessarily real-time nor accurate. The data and prices on the website are not necessarily provided by any market or exchange, but may be provided by market makers, and so prices may not be accurate and may differ from the actual price at any given market, meaning prices are indicative and not appropriate for trading purposes. Fusion Media and any provider of the data contained in this website will not accept liability for any loss or damage as a result of your trading, or your reliance on the information contained within this website.
It is prohibited to use, store, reproduce, display, modify, transmit or distribute the data contained in this website without the explicit prior written permission of Fusion Media and/or the data provider. All intellectual property rights are reserved by the providers and/or the exchange providing the data contained in this website.
Fusion Media may be compensated by the advertisers that appear on the website, based on your interaction with the advertisements or advertisers.
© 2007-2025 - Fusion Media Limited. All Rights Reserved.