Looks Like The Santa Rally Is Off To The Races

Published 12/03/2018, 12:03 AM
Updated 07/09/2023, 06:31 AM
NDX
-
US500
-
DJI
-
US2000
-
IXIC
-
SOX
-

A good finish to last week left no doubts as to which side had control of the market this coming week. Bulls stepped up Wednesday and added a finishing touch Friday. Volume climbed in confirmed accumulation. Where possible, I have drawn new resistance lines connecting October and November swing highs which are the new upside targets for current market rallies.

The S&P hasn't turned fully net bullish (in technical strength) but it's only a couple of days away from doing so. The index finished Friday on its 200-day MA which may offer some resistance on Monday. Get past that, then there is the 50-day MA before the index gets to challenge the resistance line from recent swing highs.
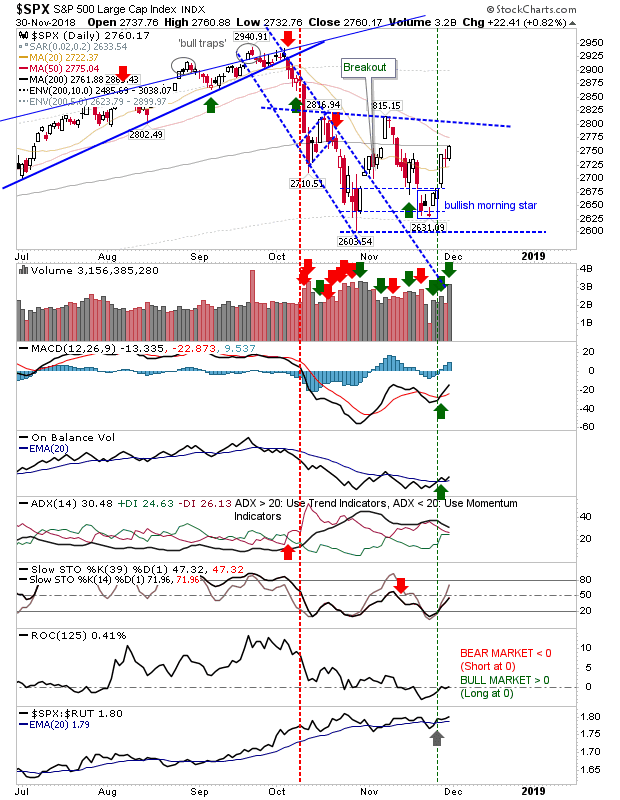
SPX Daily Chart


The Dow Jones Index did manage a net bullish technical turn. It's the only lead index to have a higher November swing high than October. It has already managed to clear its 200-day MA and has only the 50-day MA (which it finished on) as the last major point of resistance before opening up for a test of all-time highs.
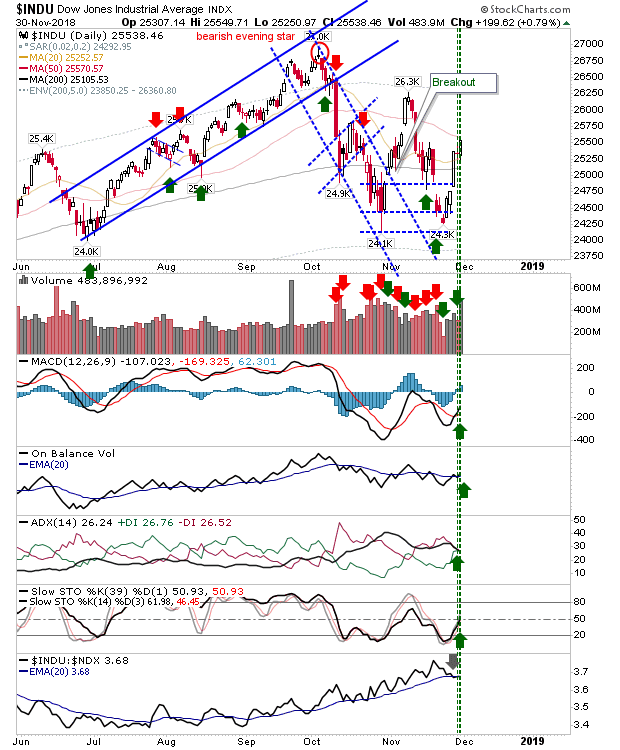
INDU Daily Chart


The NASDAQ hasn't made it as far as its 200-day MA and will run in the October-November swing high resistance line first. It has a similar technical picture as the S&P but it's slowly recovering its relative performance edge against the latter index.
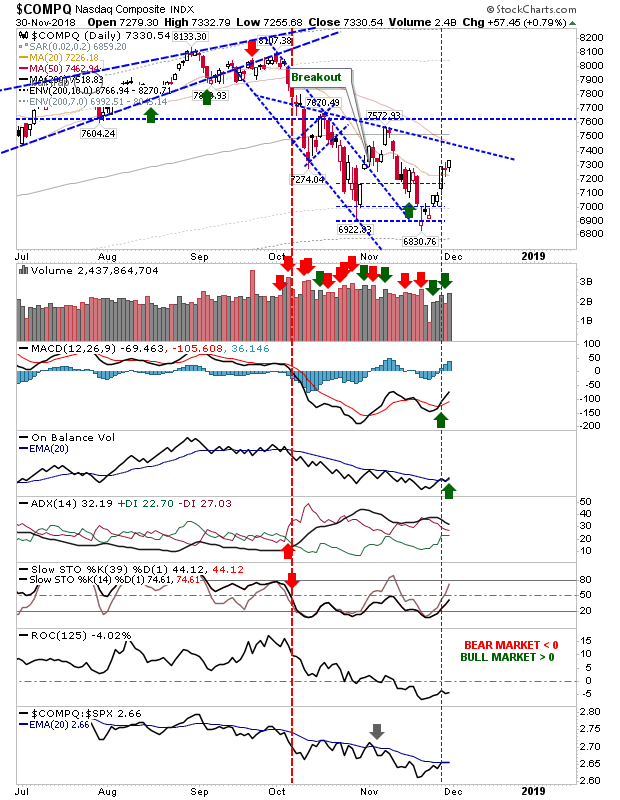
COMPQ Daily Chart


The Semiconductor Index has offered an interesting sideshow as it clears declining resistance which remains the challenge for both the NASDAQ and NASDAQ 100 - this favors a similar test and break of comparable resistance for the aforementioned indices.
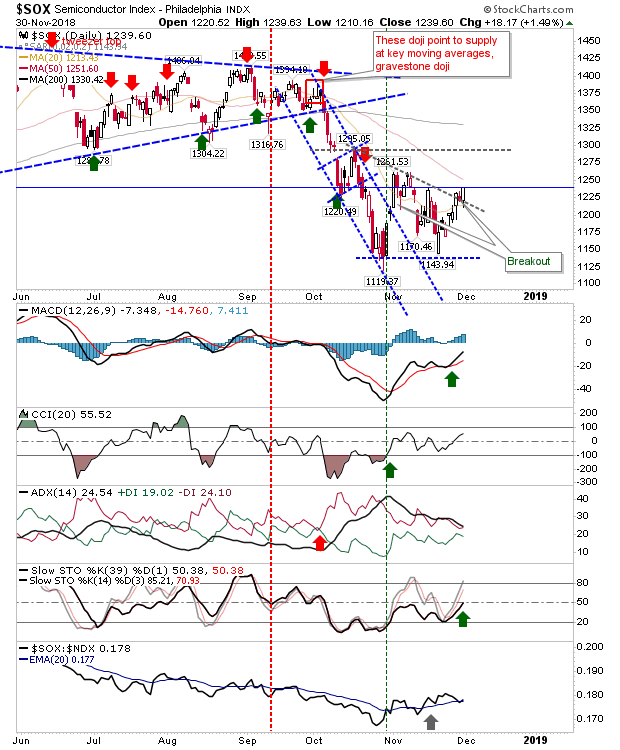
SOX Daily Chart


As for the Russell 2000, it lost some relative ground against the NASDAQ and didn't quite enjoy the same relative gains as other indices but it hasn't lost the bullish tendencies which November's swing low started.
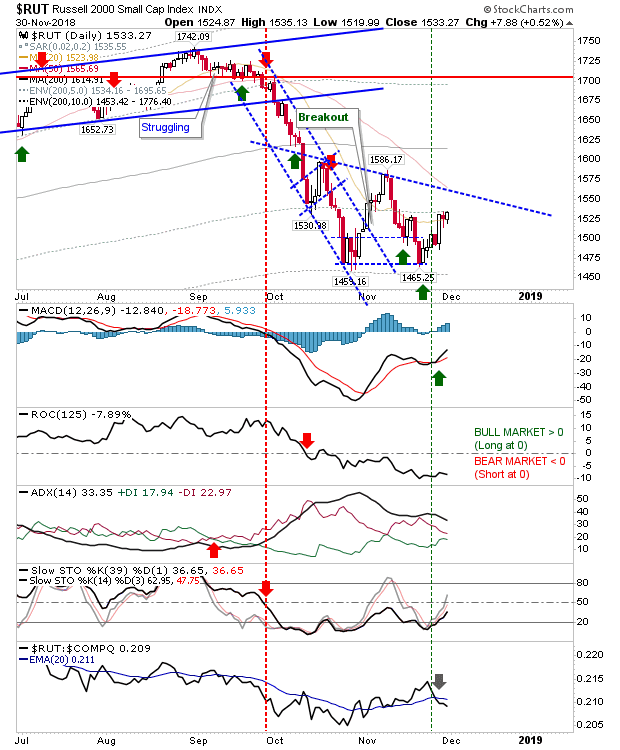
RUT Daily Chart


For today, we will want Friday's gains to be respected with either a tight inside day or (preferably) a late day surge to further squeeze shorts.

Latest comments

Loading next article…
Risk Disclosure: Trading in financial instruments and/or cryptocurrencies involves high risks including the risk of losing some, or all, of your investment amount, and may not be suitable for all investors. Prices of cryptocurrencies are extremely volatile and may be affected by external factors such as financial, regulatory or political events. Trading on margin increases the financial risks.
Before deciding to trade in financial instrument or cryptocurrencies you should be fully informed of the risks and costs associated with trading the financial markets, carefully consider your investment objectives, level of experience, and risk appetite, and seek professional advice where needed.
Fusion Media would like to remind you that the data contained in this website is not necessarily real-time nor accurate. The data and prices on the website are not necessarily provided by any market or exchange, but may be provided by market makers, and so prices may not be accurate and may differ from the actual price at any given market, meaning prices are indicative and not appropriate for trading purposes. Fusion Media and any provider of the data contained in this website will not accept liability for any loss or damage as a result of your trading, or your reliance on the information contained within this website.
It is prohibited to use, store, reproduce, display, modify, transmit or distribute the data contained in this website without the explicit prior written permission of Fusion Media and/or the data provider. All intellectual property rights are reserved by the providers and/or the exchange providing the data contained in this website.
Fusion Media may be compensated by the advertisers that appear on the website, based on your interaction with the advertisements or advertisers.
© 2007-2025 - Fusion Media Limited. All Rights Reserved.