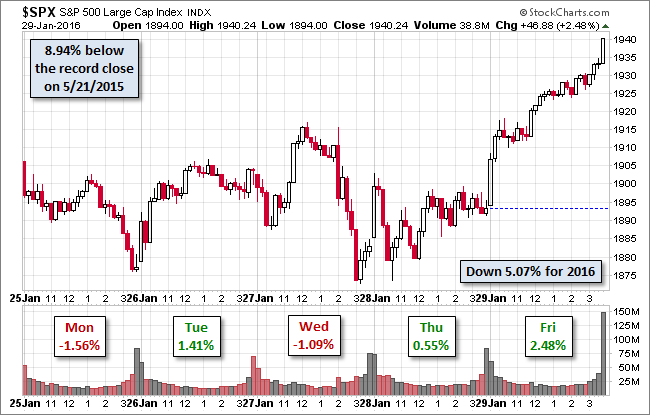
Our benchmark S&P 500 finished the month of January with its best daily gain of 2016, a 2.48% surge. In fact, today's gain for the index was the best percentage rise since its 2.51% surge in early September. US equity indexes followed the pattern of major indexes around the world, which rose dramatically in response to Japan's announced policy of negative interest rates. The Nikkei was up 2.8%, The Shanghai Composite 3.09% and the Euro STOXX 50 2.2%. The question is whether today's rally was a knee-jerk reaction or an end to the correction, since today's gain lifted the 500 above the correction level. It is now down 8.94% from its record close last May.
The yield on the 10-year note closed at 1.94%, down 6 basis points from the previous close and its lowest yield since April of last year.
Here is a snapshot of past five sessions.
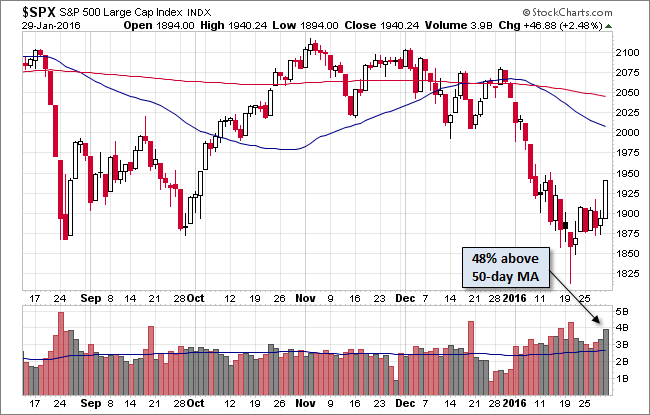
Here is a daily chart of the index. Volume surged on today's gain.
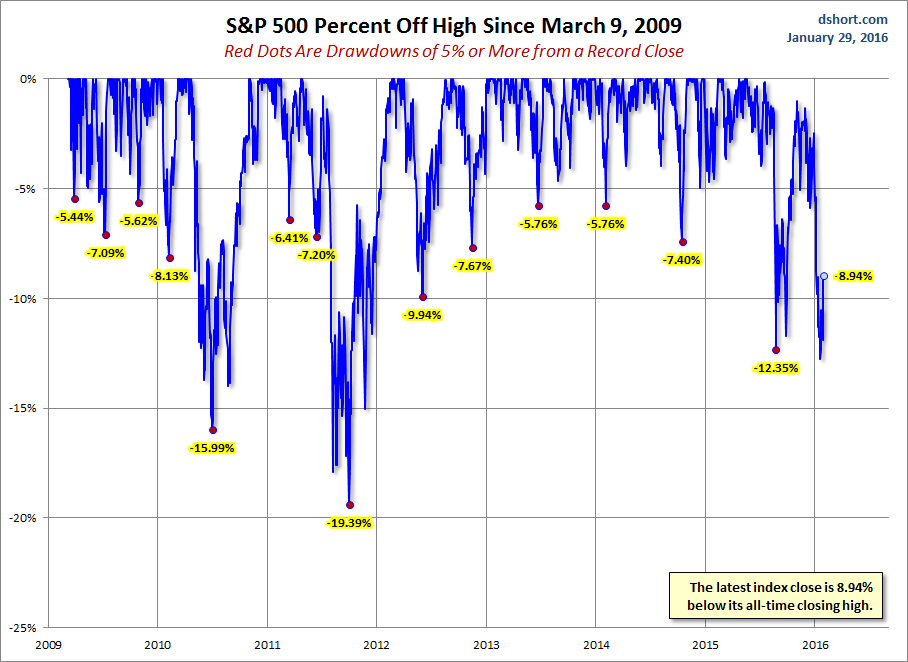
A Perspective on Drawdowns
Here's a snapshot of selloffs since the 2009 trough.
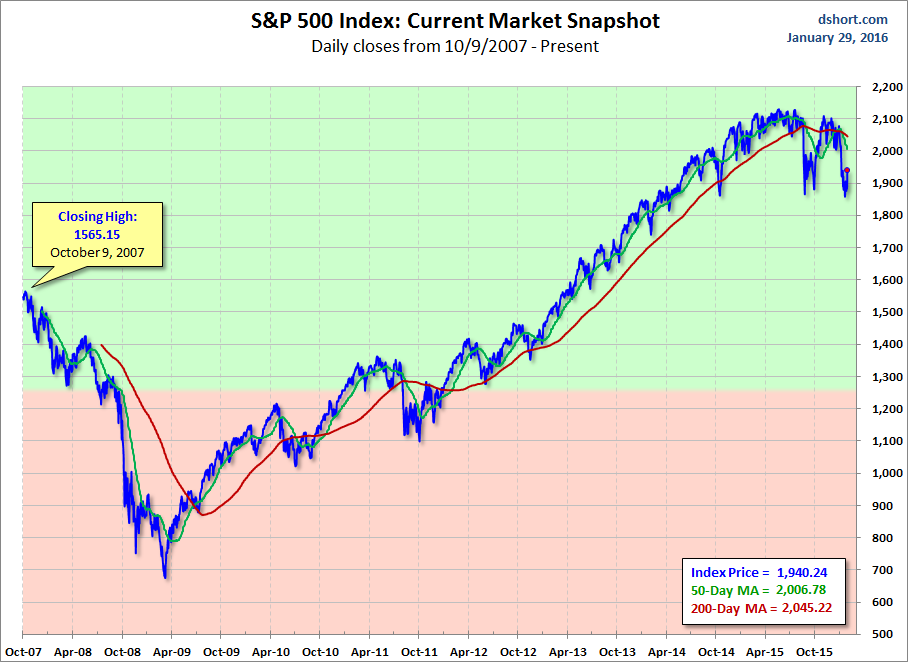
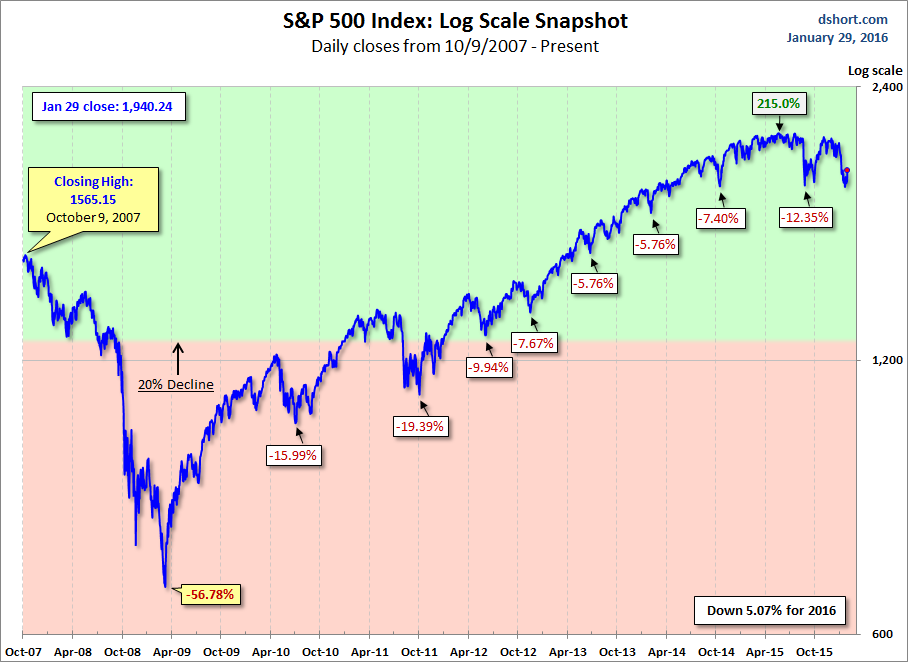
For a longer-term perspective, here is a log-scale chart base on daily closes since the all-time high prior to the Great Recession.
Here is the same chart with the 50- and 200-day moving averages.
