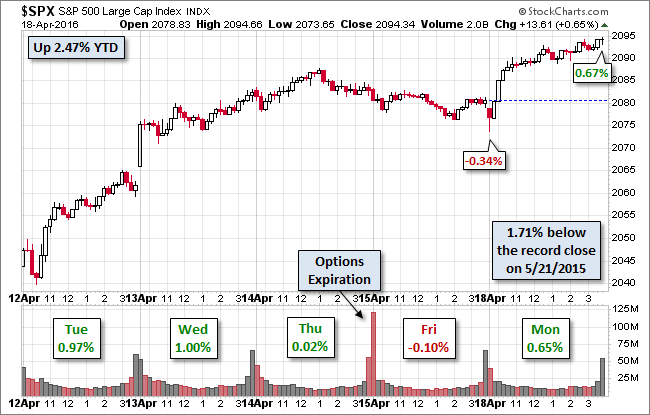
Asian market had a bad start to the week. The Shanghai Composite fell 1.43% and the Nikkei a much worse 3.40% decline. The financial pundits blamed the Doha outcome on oil for the general decline and the quakes in Japan for the Nikkei rout. But European equity indexes blew off the oil anxiety and posted modest gains. The Euro STOXX 50 benchmark rose 0.32% after some early selling. US indexes followed the European model. The S&P 500 hit its -0.34% low shortly after the open and then rallied to a steadily higher trend to its 0.65% closing gain, just a tad off its 0.67% intraday high shortly before the final bell.
The yield on the 10-year note closed at 1.78%, up two basis points from the previous close.
Here is a snapshot of past five sessions in the S&P 500.
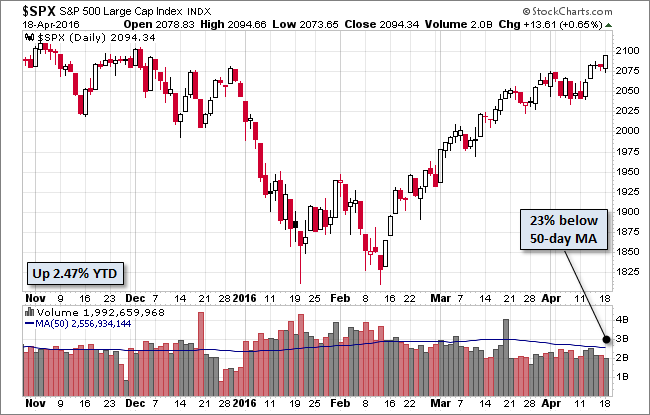
Here is a daily chart of the index, which is now up about 2.5% for the year and closing in on its record high of last May. Volume was weak.
A Perspective on Drawdowns
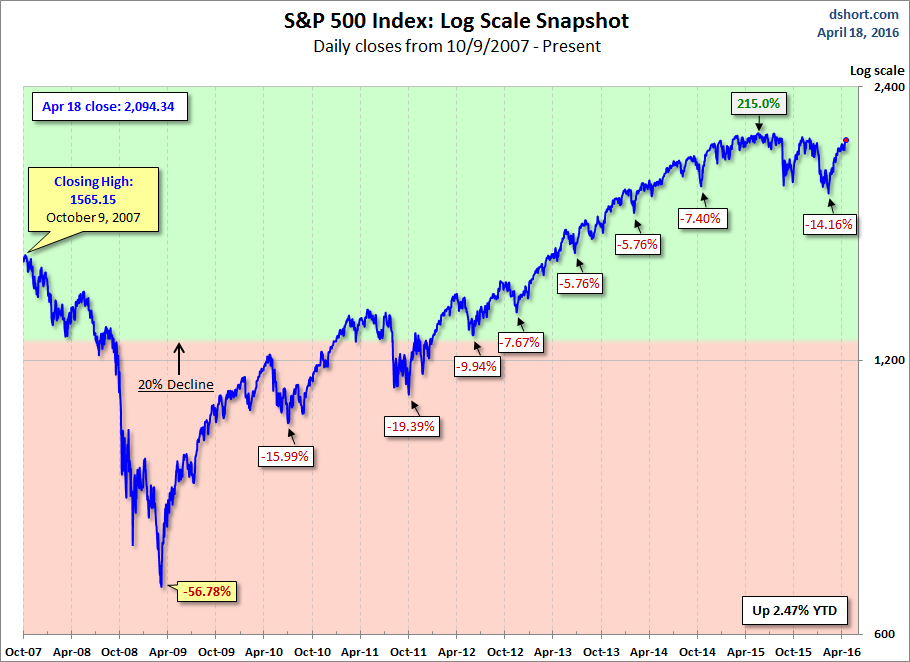
Here's a snapshot of selloffs since the 2009 trough.
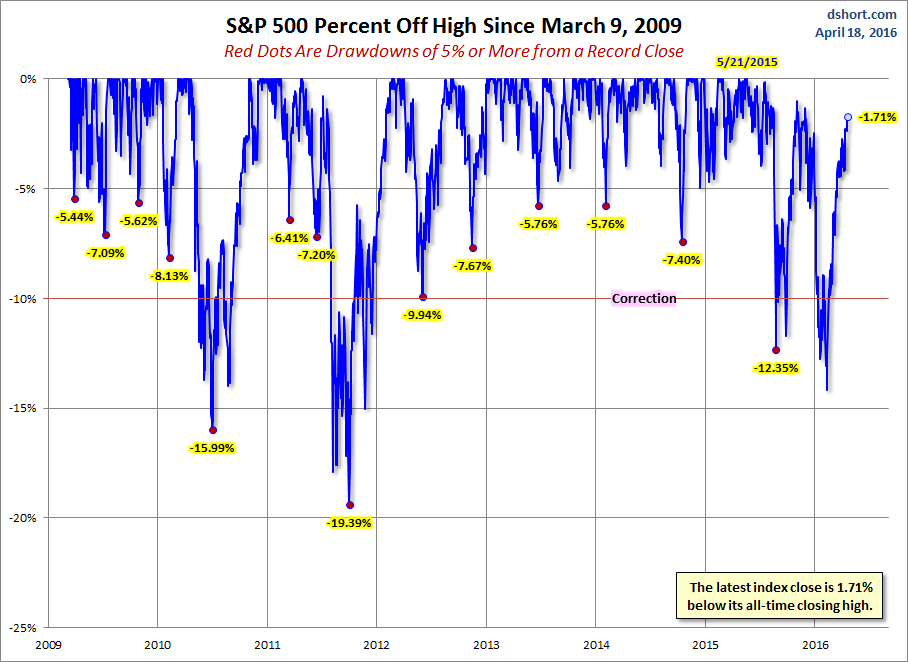
Here is a more conventional log-scale chart with drawdowns highlighted.
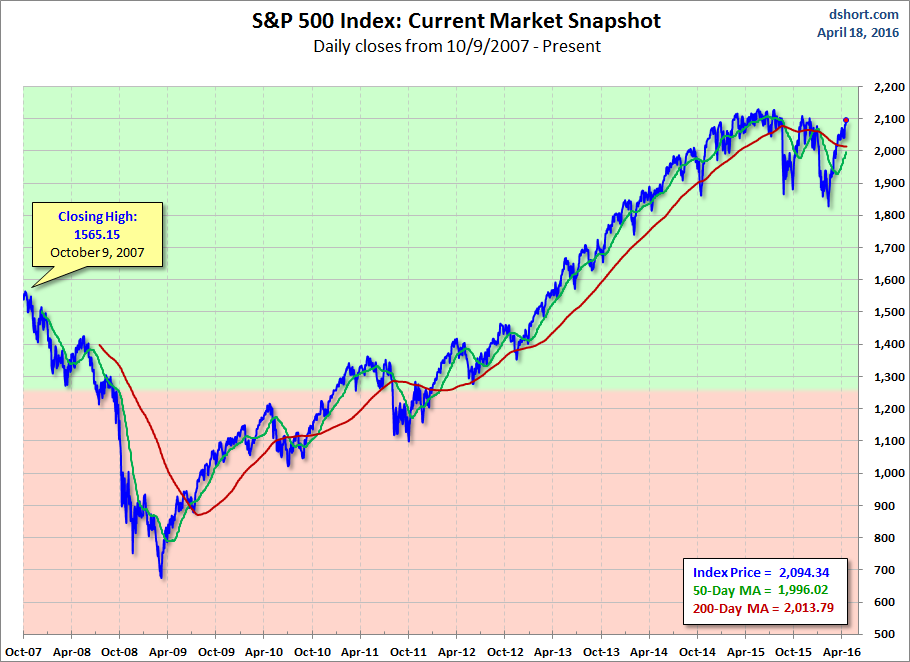
Here is a linear scale version of the same chart with the 50- and 200-day moving averages.
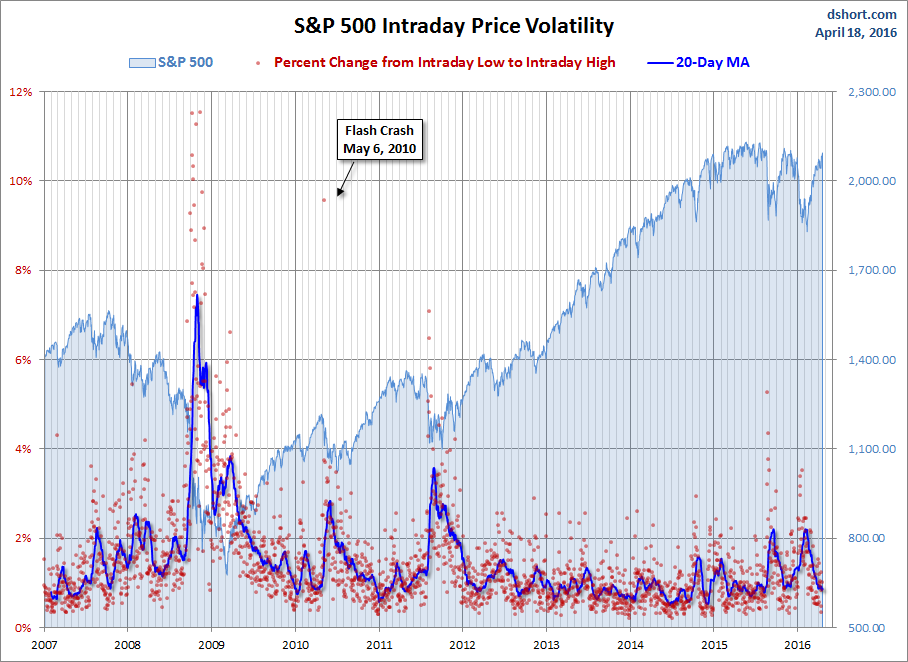
A Perspective on Volatility
For a sense of the correlation between the closing price and intraday volatility, the chart below overlays the S&P 500 since 2007 with the intraday price range. We've also included a 20-day moving average to help identify trends in volatility.
