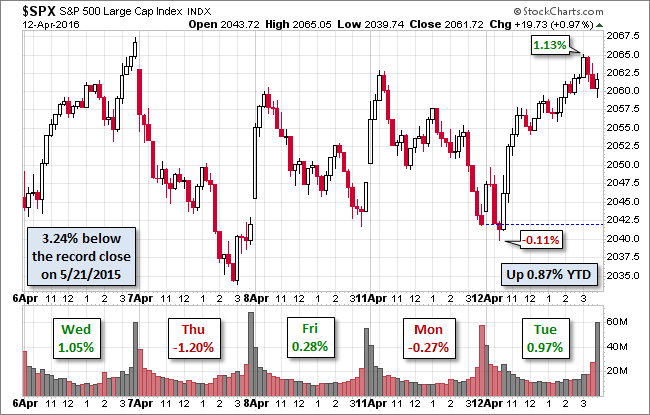
Global markets had a good day today. Most Asian indexes posted gains with the Nikkei up 1.13% although the Shanghai was a laggard, down 0.31%. European indexes were more uniformly positive, with the STOXX 50 up 0.61% and the FTSE up 0.68%. Our benchmark S&P 500 vacillated at the open, rising fractionally and then falling to its -0.11% intraday low about 45 minutes later. But the index then surged higher and rallied steadily to its 1.13% afternoon high about an hour before the close. It ended the session with a trimmed gain of 0.97%.
The yield on the 10-year note closed at 1.79%, up six basis points from the previous close.
Here is a snapshot of past five sessions in the S&P 500.
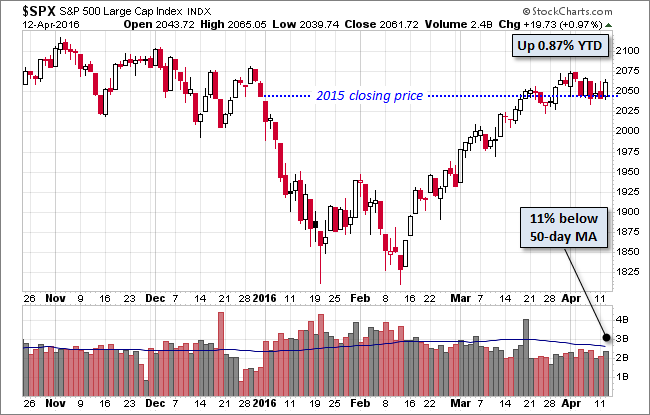
Here is a daily chart of the 500 with the 2015 closing price highlighted. We see that the index has been see-sawing around that level since for the past seventeen sessions. It's a level that has provided support since the first of April. It will be interesting to see the price behavior as the Q1 earnings season picks up steam in the days ahead.
A Perspective on Drawdowns
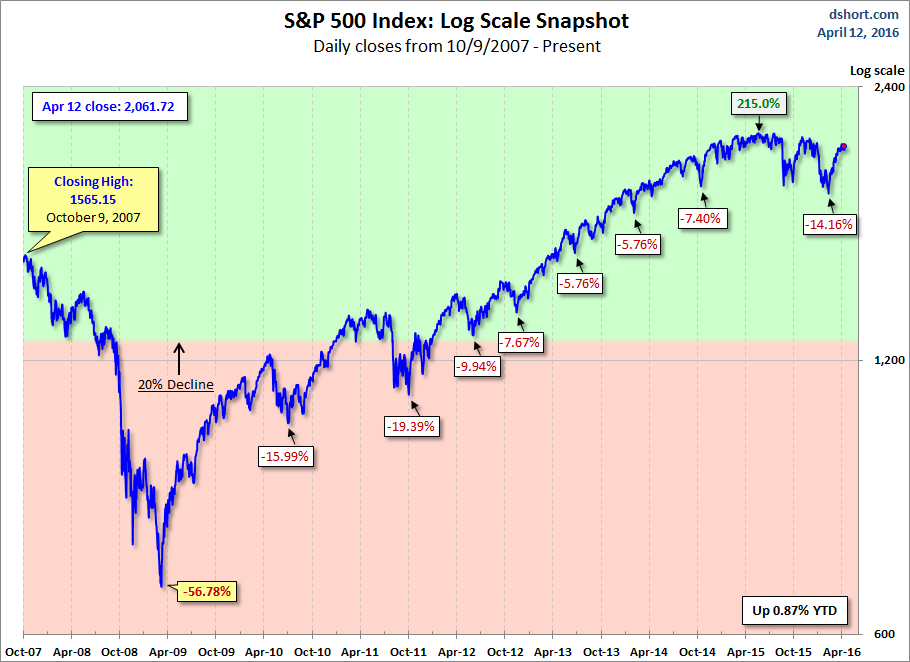
Here's a snapshot of selloffs since the 2009 trough.
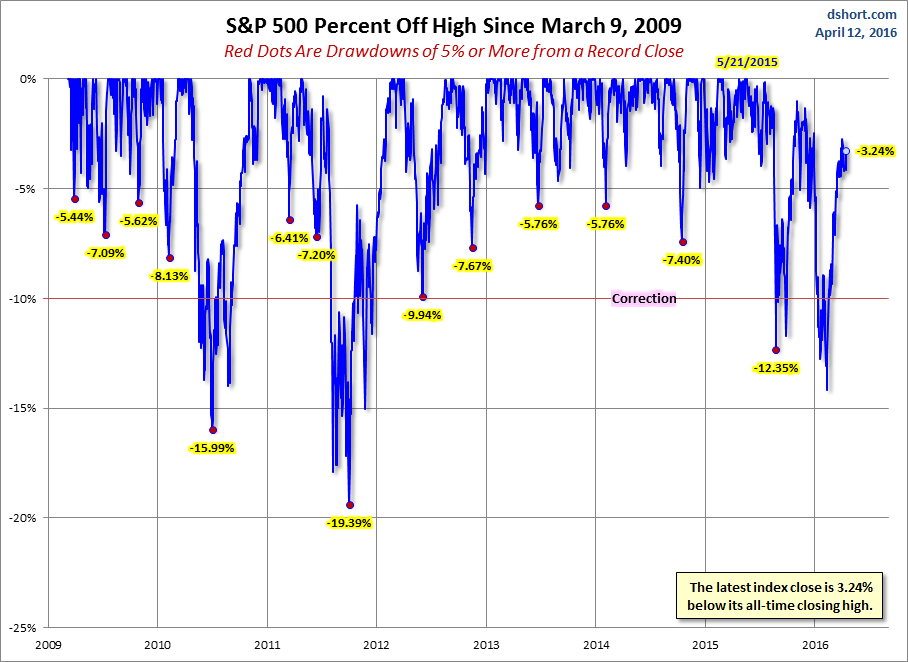
Here is a more conventional log-scale chart with drawdowns highlighted.
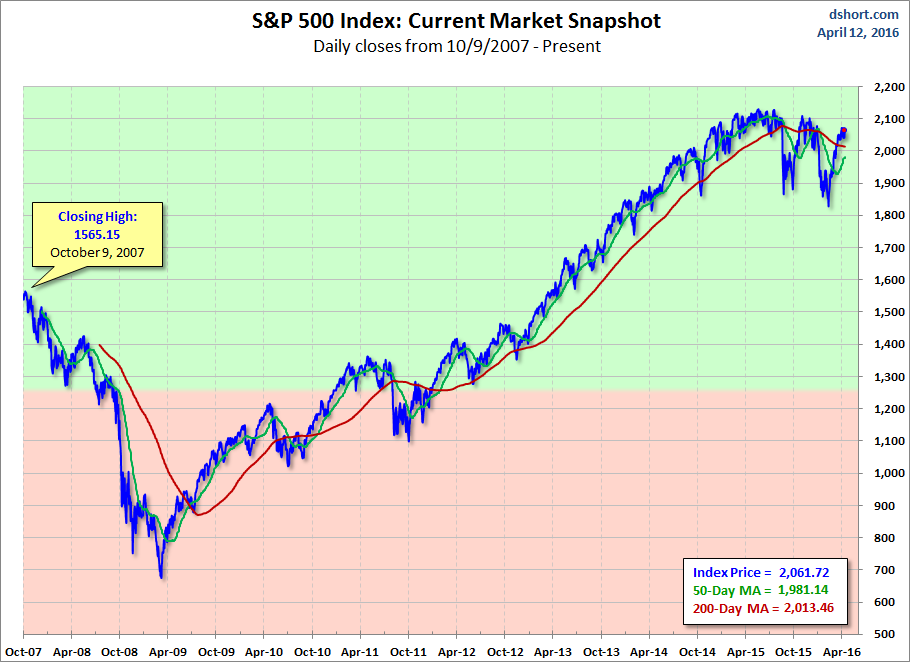
Here is a linear scale version of the same chart with the 50- and 200-day moving averages.
A Perspective on Volatility
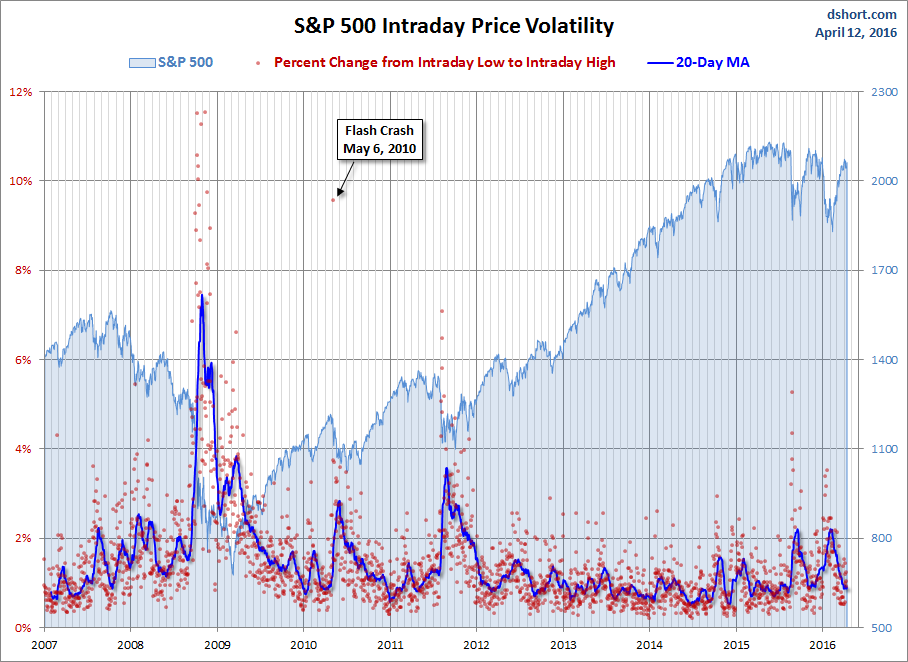
For a sense of the correlation between the closing price and intraday volatility, the chart below overlays the S&P 500 since 2007 with the intraday price range. We've also included a 20-day moving average to help identify trends in volatility.
