Russell 2000 Tags Resistance As S&P Breaks (Again!)

Published 01/15/2018, 12:00 AM
Updated 07/09/2023, 06:31 AM
NDX
-
US500
-
US2000
-
IXIC
-
SOX
-

I forgot to mention last week that the S&P has reached the "15% of Profit Take" zone of historical price action relative to the 200-day MA dating back to 1950. If it reaches 1,653 it will be in the 5% percentile of historic action – a 'strong sell' signal. The price tag came with a fresh breakout from the channel; the second breakout in 2018.
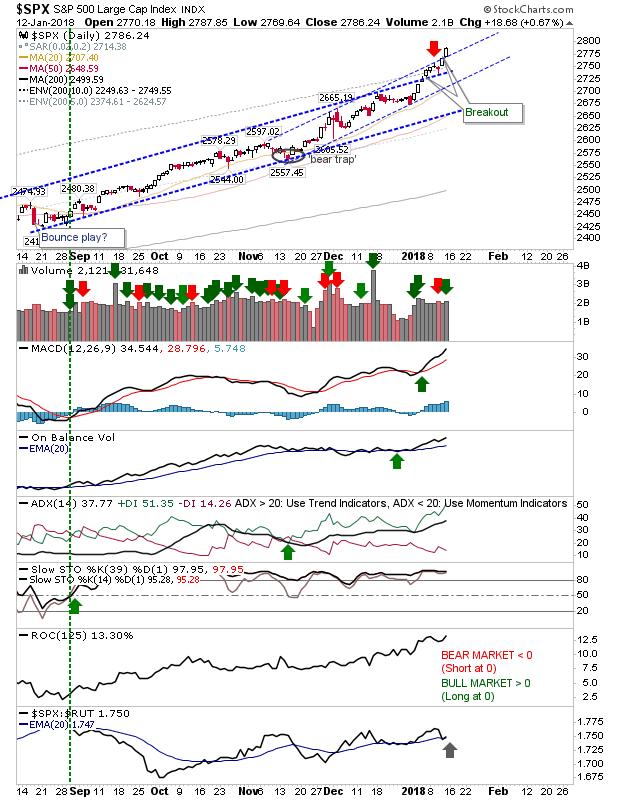
SPX Daily Chart


After Thursday's strong performance the Russell 2000 tagged channel resistance, offering a chance for some profit taking and potentially a shorting opportunity too. Technicals remain healthy although the index continues to struggle in relative performance against the NASDAQ.
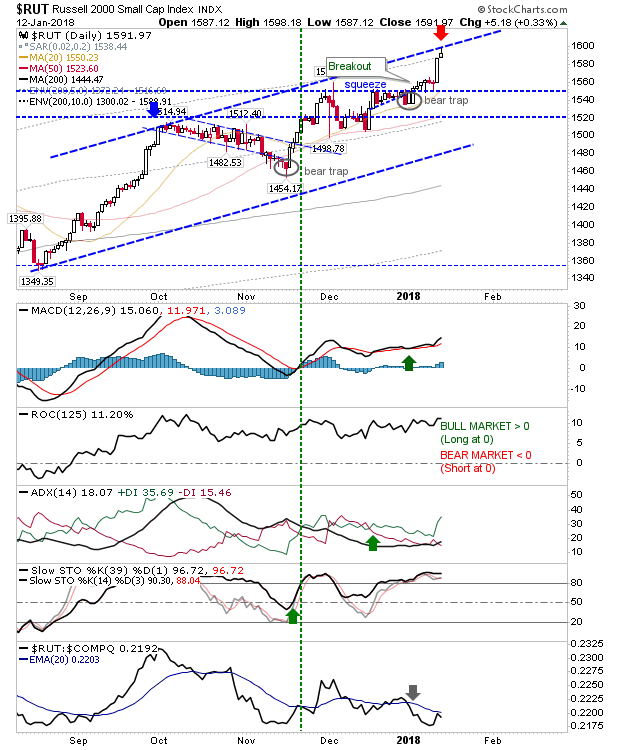
RUT Daily Chart


The NASDAQ also broke clear of its price channel. Unlike the S&P it hasn't reached the 15% zone of historic price action so there is no immediate pressure to suggest a top is near.
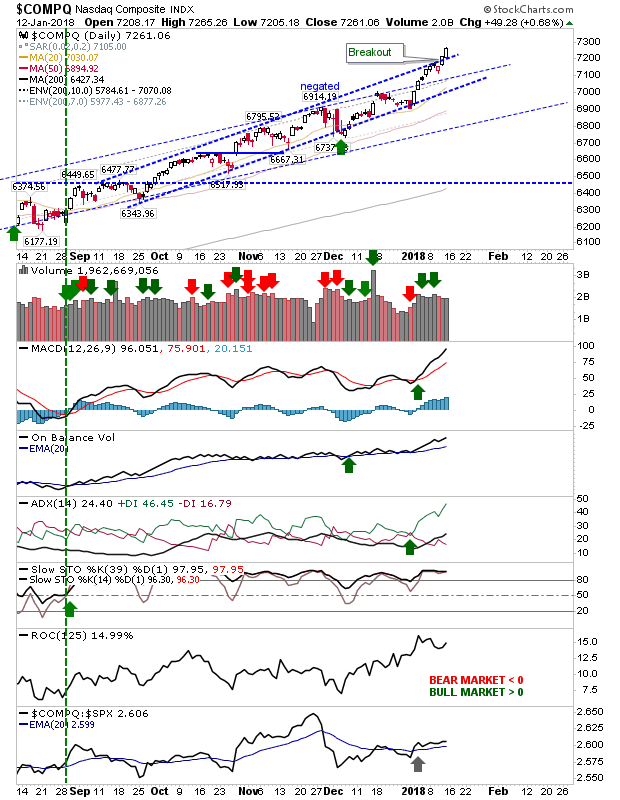
COMPQ Daily Chart


The NASDAQ 100 also cleared its channel, negating the potential short position on the channel tag. A new short position will offer itself if it can generate a 'bull trap' (i.e. a return inside the rising channel).
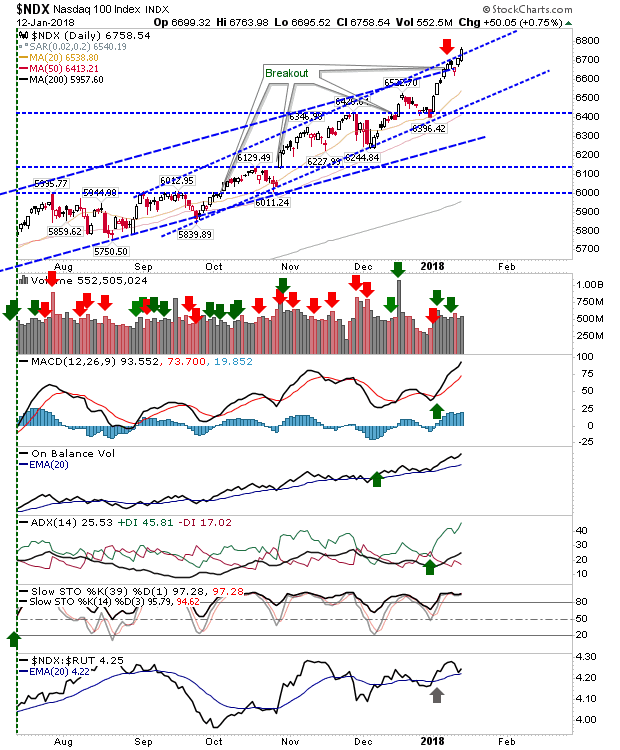
NDX Daily Chart


Meanwhile, the 'bull trap' in the Semiconductor Index is still in effect despite the last two days of gain.
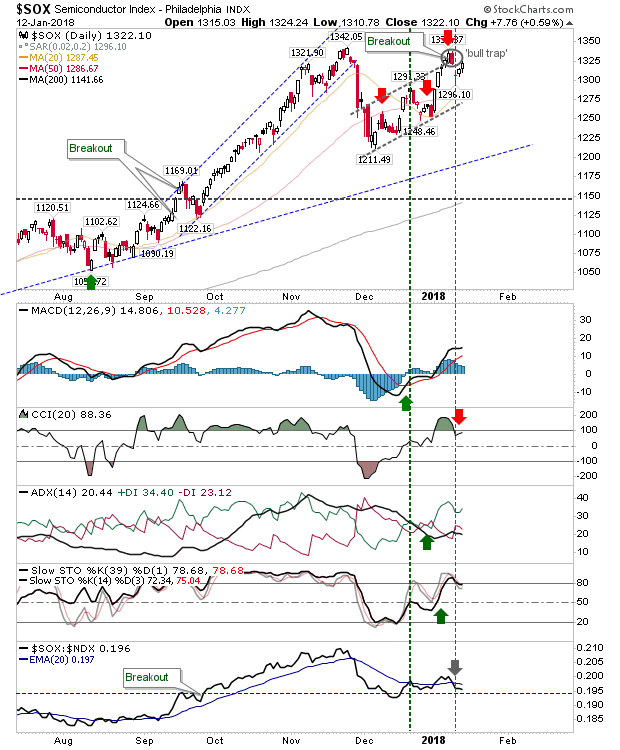
SOX Daily Chart


For MONDAY, watch for 'bull traps' in the indices which have broken channel resistance. The Russell 2000 is the best of the trading opportunities (as a short).

Latest comments

Loading next article…
Risk Disclosure: Trading in financial instruments and/or cryptocurrencies involves high risks including the risk of losing some, or all, of your investment amount, and may not be suitable for all investors. Prices of cryptocurrencies are extremely volatile and may be affected by external factors such as financial, regulatory or political events. Trading on margin increases the financial risks.
Before deciding to trade in financial instrument or cryptocurrencies you should be fully informed of the risks and costs associated with trading the financial markets, carefully consider your investment objectives, level of experience, and risk appetite, and seek professional advice where needed.
Fusion Media would like to remind you that the data contained in this website is not necessarily real-time nor accurate. The data and prices on the website are not necessarily provided by any market or exchange, but may be provided by market makers, and so prices may not be accurate and may differ from the actual price at any given market, meaning prices are indicative and not appropriate for trading purposes. Fusion Media and any provider of the data contained in this website will not accept liability for any loss or damage as a result of your trading, or your reliance on the information contained within this website.
It is prohibited to use, store, reproduce, display, modify, transmit or distribute the data contained in this website without the explicit prior written permission of Fusion Media and/or the data provider. All intellectual property rights are reserved by the providers and/or the exchange providing the data contained in this website.
Fusion Media may be compensated by the advertisers that appear on the website, based on your interaction with the advertisements or advertisers.
© 2007-2025 - Fusion Media Limited. All Rights Reserved.