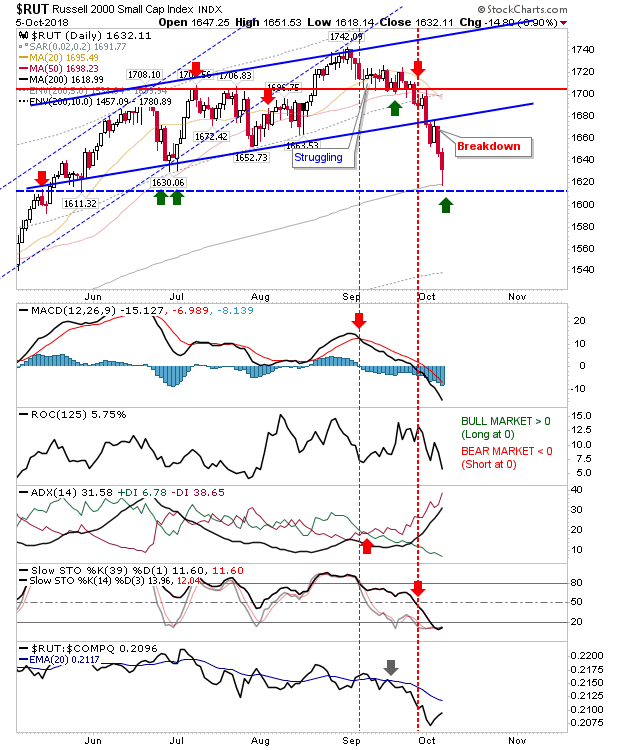
On Friday, indices recorded another set of losses but some now offer an opportunity for longs. Best of these belong to the Russell 2000.
The Russell 2000 managed a picture perfect tag of the 200-day MA with Friday's lows making it to 1,618. Shorts trading the tag (of the 200-day MA) will have come out with a nice profit and aggressive longs may have also used the opportunity to trade a bounce with a buy.
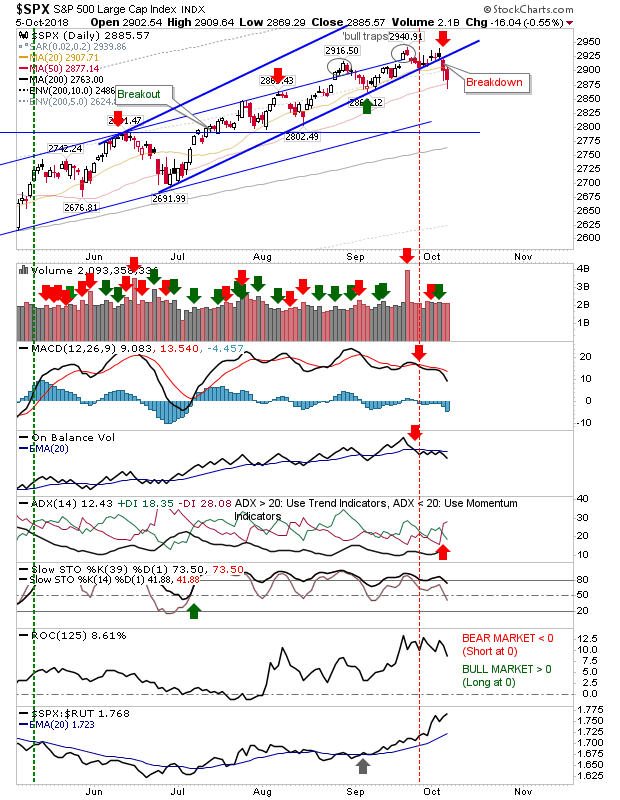
The S&P had breached channel support Thursday and encountered its first support test at the 50-day MA on Friday. Aside from Stochastics, other technicals are bearish but where action in the Russell 2000 looks like a shift to a new bear trend, here, things look more like a slowing of the trend - perhaps the start of a sideways pattern for the index.
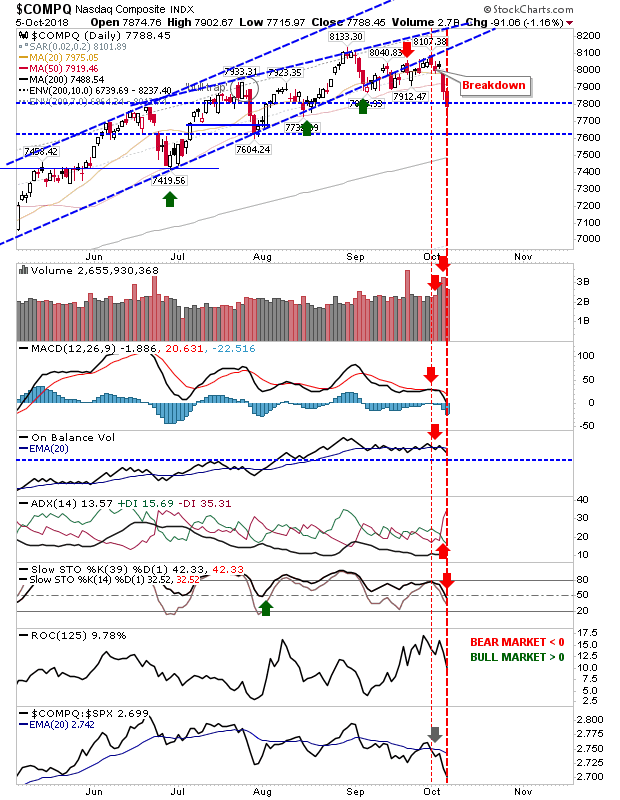
The NASDAQ wasn't so lucky on Friday. It was unable to defend its 50-day MA. All technicals are now net bearish and that rising price channel from the summer is looking a distant memory. As with the Russell 2000, the next target for the NASDAQ is the 200-day MA.
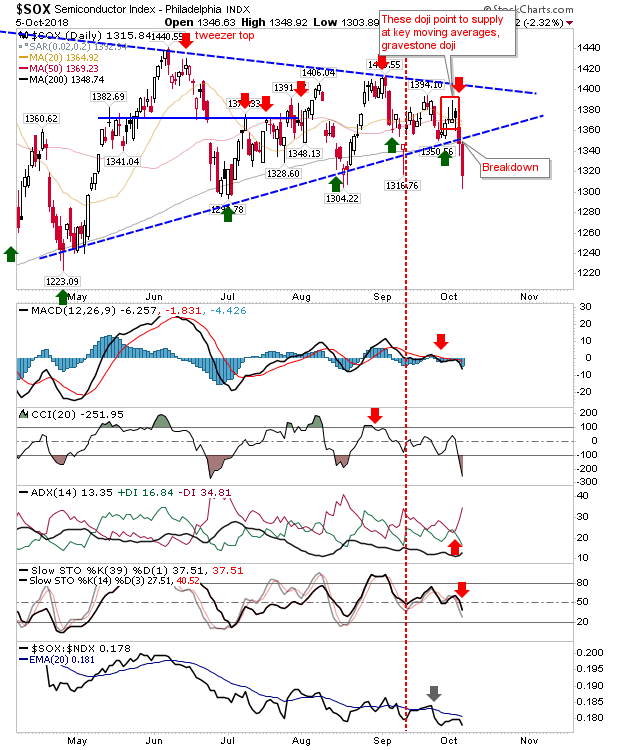
Feeding into this weakness is the decisive breakdown in the Semiconductor Index. There was no doubt as to which side finished the week on top. All technicals are negative and relative performance has been struggling since June.
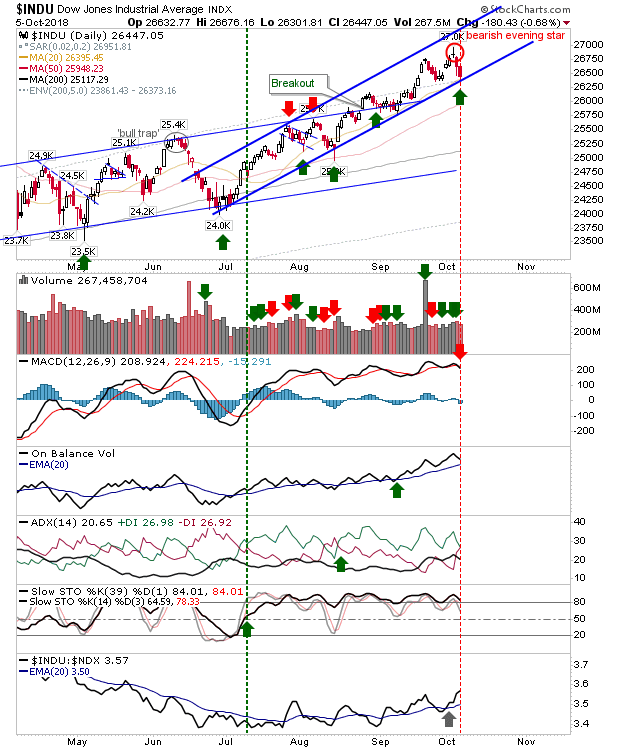
On the bullish side there is the Dow Jones Index. It tagged accelerated channel support with Friday's close. Technicals are mostly positive with the exception of a new 'sell' trigger in the MACD. Momentum buyers could take a punt on this, given its prior strength. Relative performance continues to advance after an early half-of-year underperformance. This could increase as money cycles into outperforming indices.
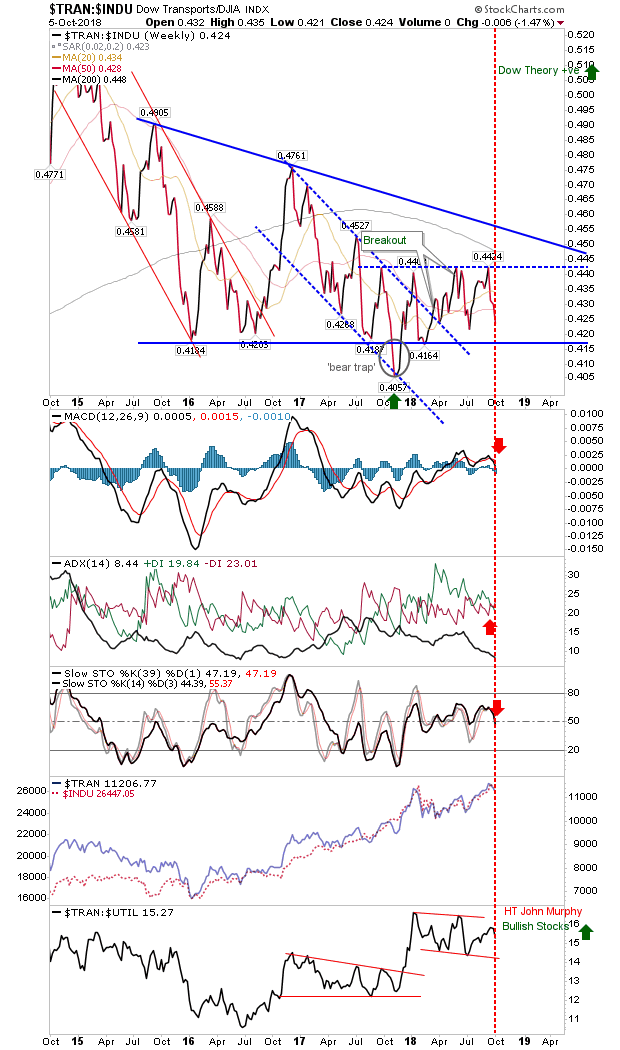
Speaking of the Dow Jones, my Dow Theory index watcher is struggling to get out of its trading range. Look how all major moving averages are beginning a roll over and will play as resistance. Technicals are bearish and at levels where further losses are likely. Watch this long-term indicator closely - weak transports => weak(ening) economy => bearish. Don't expect Trump to own this one when it cracks.
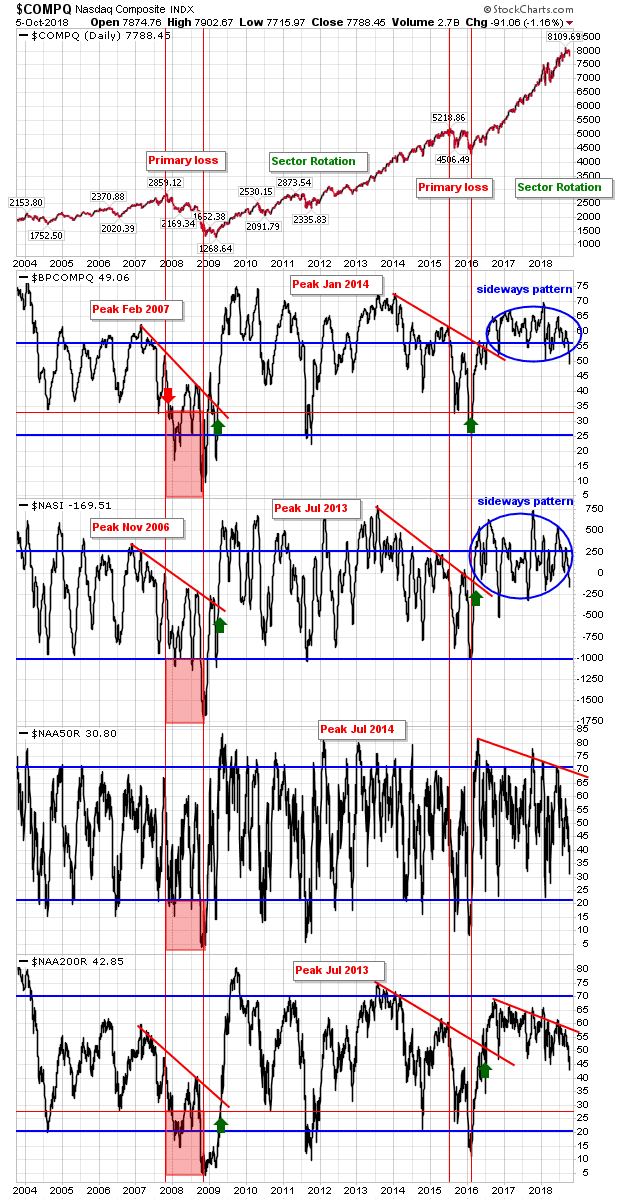
Breadth metrics for the NASDAQ are also moving out of a 2-year consolidation and into a new phase of weakness. Given the weak state of other metrics (e.g. the Semiconductors) it's all looking like a perfect storm for bears/shorts to go aggressive on Tech stocks/Indices.
The battle lines are drawn for today. Prudent (short) traders will look to attack rallies off key moving averages as profit takers adopt a wait-and-see approach on growing tech weakness. Aggressive longs can also use these moving averages as a buying opportunity, but don't hold these positions if over the coming days these averages are lost.
