This past week, despite the Fed’s “non-event” meeting, the story of the market has been earnings. As of July 20th, the latest update from S&P 500 showed the following statistics.

With a slew of new companies reporting this week these numbers will change, but not drastically so.
While the backdrop of 72.92% of companies beating estimates is certainly bullish, it should be remembered these “beats” come from two primary factors:
1) Lowered estimates
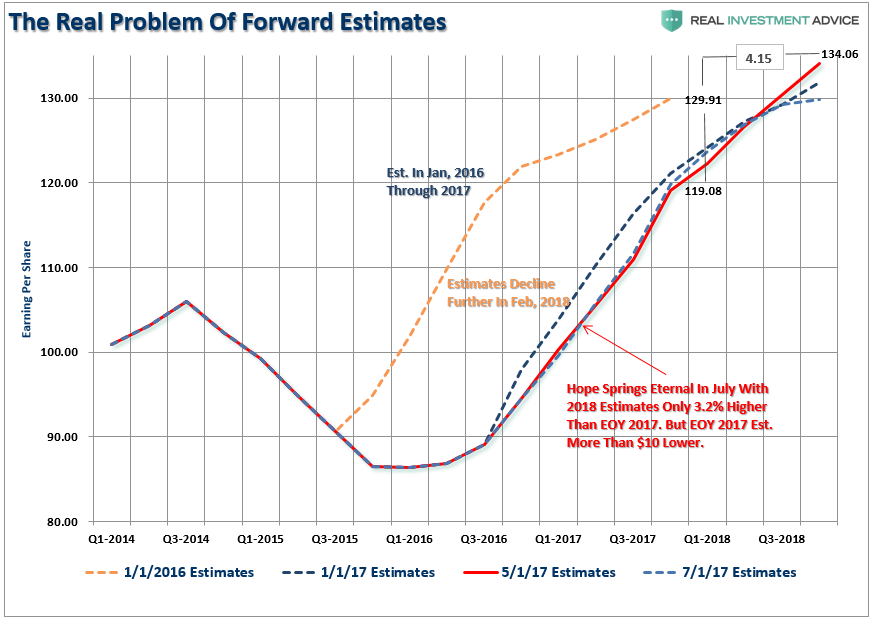
As my friend Anora Mahmudova recently wrote:
“But despite positive quarterly reports, an analysis of earnings calls suggests optimism may have peaked, the analysts said in a note, observing ‘a drop-off in mentions of ‘better’ relative to ‘worse’ or ‘weaker’ words.’
Moreover, the cut to third-quarter consensus earnings-per-share estimates is so far the largest since the fourth quarter of 2015, when profit growth was still declining and recession fears were percolating.”
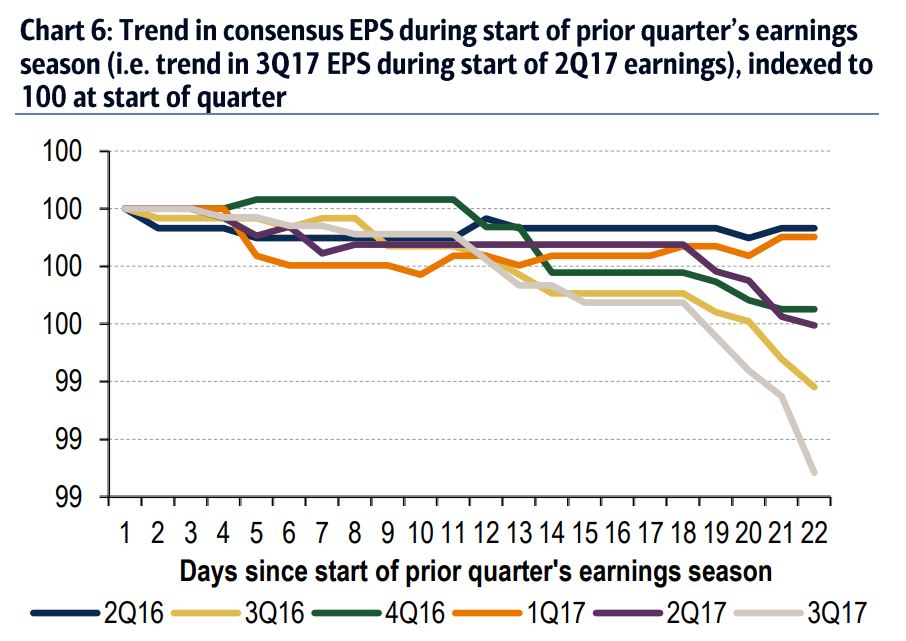
“The rapid deterioration in outlook is worrisome due to stretched valuations and other macro risks.”
As she notes, the upside in the market is limited, given already stretched valuations. If markets rise further from here, it will be due to euphoria rather than fundamentals. With health care reform failing to be passed, the legislative agenda of tax reform is now officially dead because it had to be done through reconciliation. Furthermore, the risk of a debt ceiling debate looms as well as potential policy errors by the Federal Reserve.
2) Share buybacks
Yes, earnings look good, only due to the fact that 72.94% of the companies on the S&P 500 have lower shares outstanding than just one year ago. One of the best ways to show the impact of lowered shares as it relates to higher operating profits is as follows: (For more information read this.)
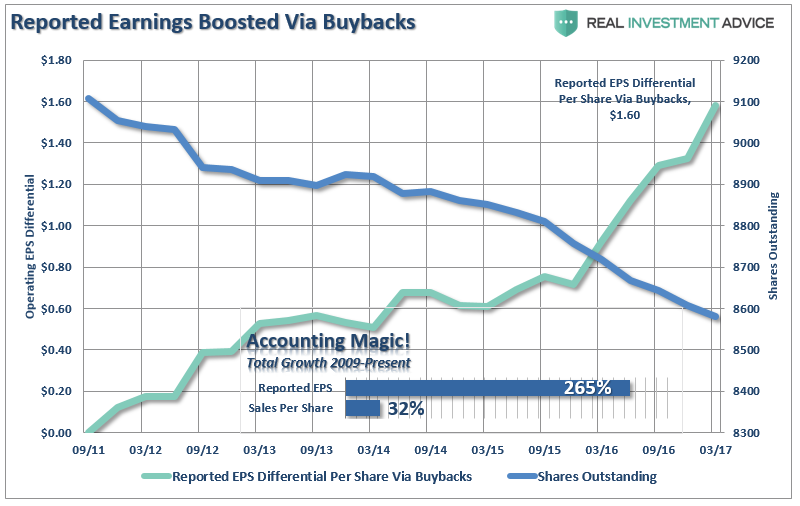
It has been these share buybacks that have allowed companies to win the“beat the estimate” game which has kept the bulls clearly in charge of the markets and our portfolios allocated on the long-side currently.
However, in the longer-term, the benefits derived from continuing levels of share reductions, accounting gimmicks, wage suppression, etc. are finite. As shown above, with total top-line revenue growth since 2009 is running at a very weak 32%, there is not a tremendous amount of wiggle room to offset a drop in consumer demand or a weaker economic outlook.
Is This The Bubble? (Update)
Last week I penned an article asking “Is This The Bubble?”
Not surprisingly, it didn’t take long for someone to ask THE question.

First, let me show you where it is in 3-charts.
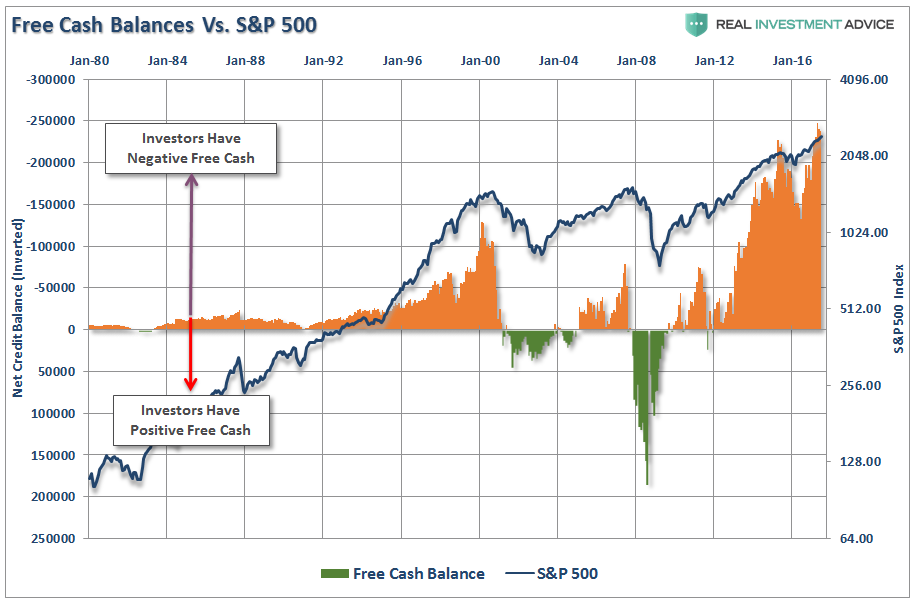
Leverage
The level of negative net credit balances is near the highest level on record. While margin debt is not a problem as long as markets are rising as leverage fuels the bullish advance, it burns uncontrollably on the way down.
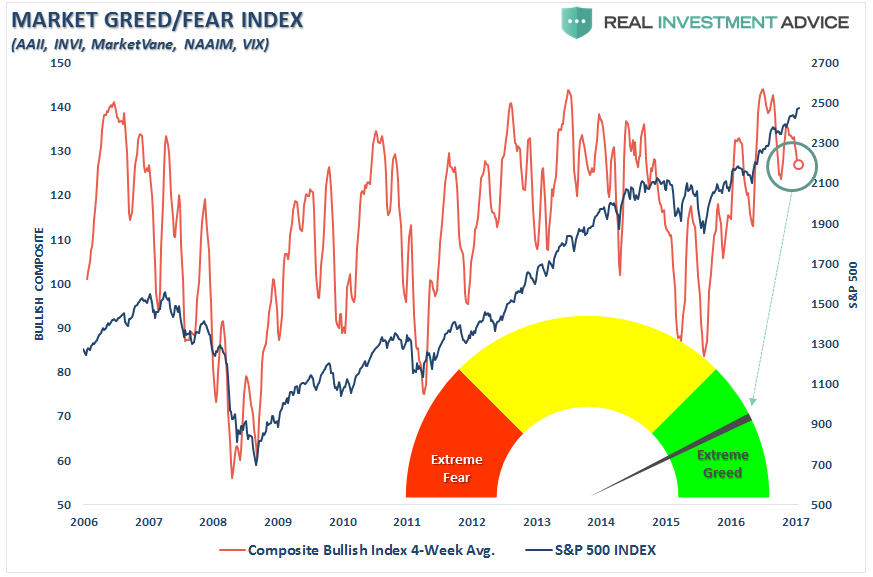
Exuberance
The following chart is a composite gauge built on several measures of investor psychology as noted. I have also smoothed the index using a 4-week moving average.
Valuations
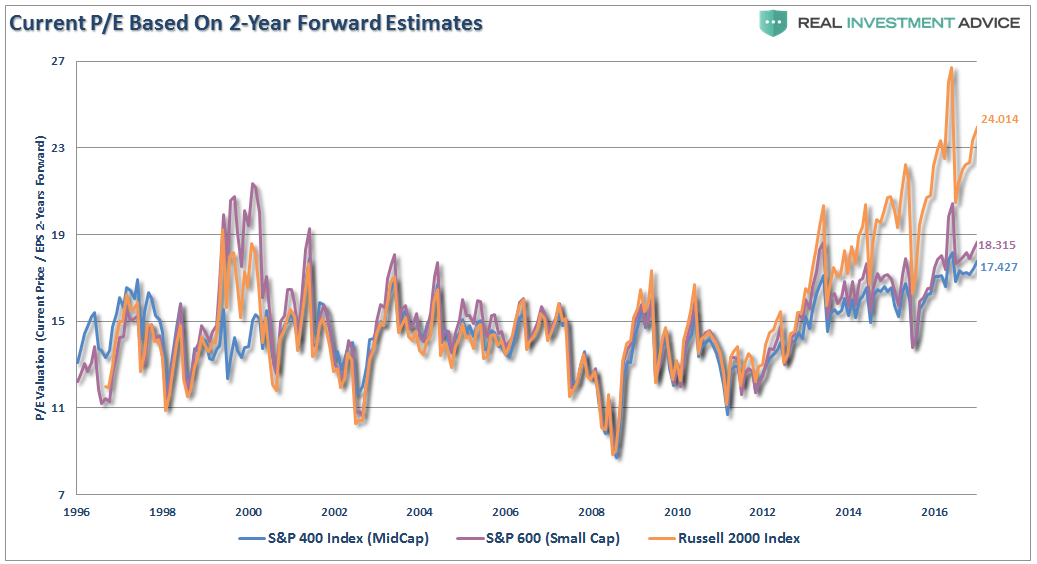
We can look at valuations in small to mid-capitalization companies as a measure of speculation in the markets. With the Russell 2000 and Small Cap 600 currently running near all-time valuation levels, and Mid Cap 400 at record levels, based on earnings estimates 2-years forward (which are always overstated), there is little to suggest speculation is not currently running rampant.
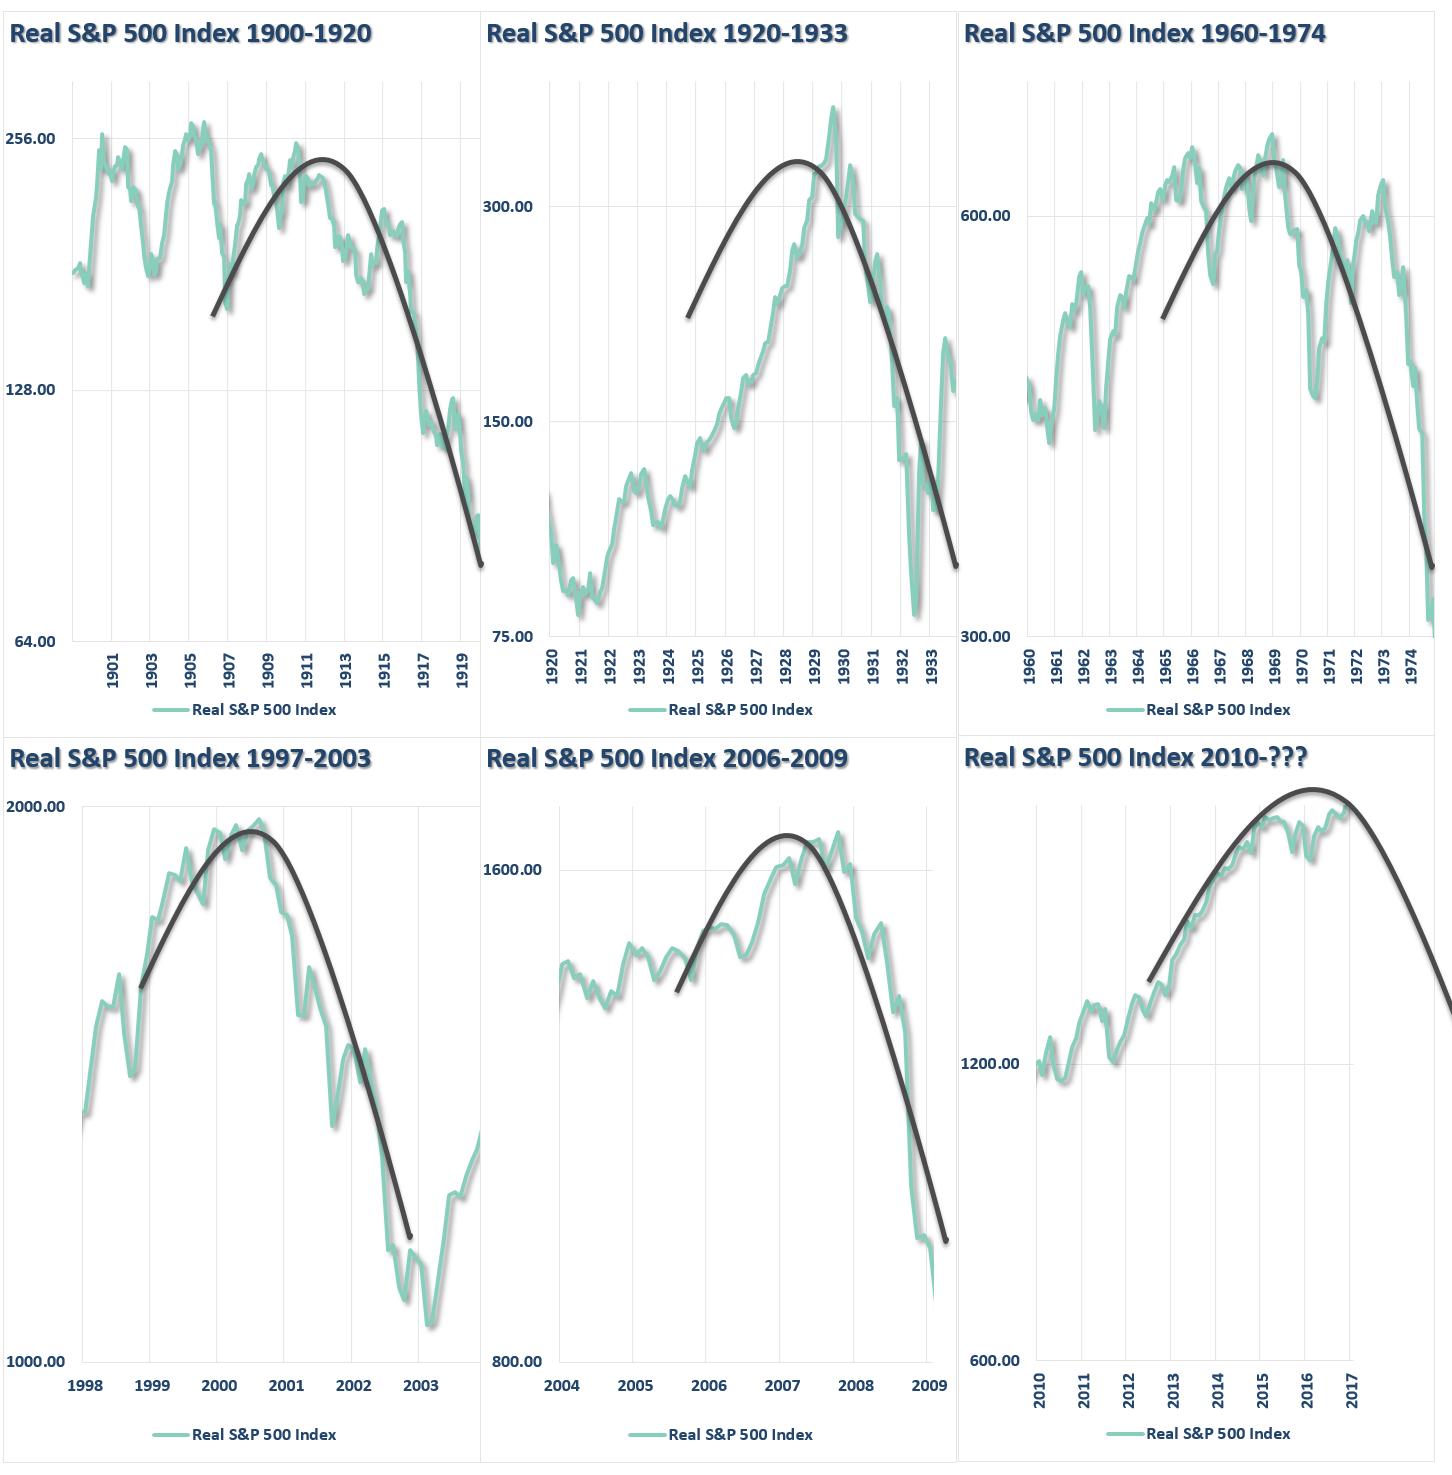
Unfortunately, bubbles are never seen in advance. The chart below is an example of asymmetric bubbles.

This idea of asymmetric bubbles was discussed by George Soros who stated:
“Typically bubbles have an asymmetric shape. The boom is long and slow to start. It accelerates gradually until it flattens out again during the twilight period. The bust is short and steep because it involves the forced liquidation of unsound positions.”
Soros’ view on the pattern of bubbles is interesting because it changes the argument from a fundamental view to a technical view. Prices reflect the psychology of the market which can create a feedback loop between the markets and fundamentals. As Soros stated:
“Financial markets do not play a purely passive role; they can also affect the so-called fundamentals they are supposed to reflect. These two functions, that financial markets perform, work in opposite directions. In the passive or cognitive function, the fundamentals are supposed to determine market prices. But, in the active or manipulative function market, prices find ways of influencing the fundamentals.
When both functions operate at the same time, they interfere with each other. The supposedly independent variable of one function is the dependent variable of the other, so that neither function has a truly independent variable. As a result, neither market prices nor the underlying reality is fully determined. Both suffer from an element of uncertainty that cannot be quantified.”
The chart below utilizes Dr. Robert Shiller’s stock market data going back to 1900 on an inflation-adjusted basis. I then took a look at the markets prior to each major market correction and overlaid the asymmetrical bubble shape as discussed by George Soros.
There is currently much debate about the health of financial markets. Have we indeed found the “Goldilocks economy?” Can prices can remain detached from the fundamental underpinnings long enough for an economy/earnings slow down to catch back up with investor expectations?
The speculative appetite for “yield,” which has been fostered by the Fed’s ongoing interventions and suppressed interest rates, remains a powerful force in the short term. Furthermore, investors have now been successfully “trained” by the markets to “stay invested” for “fear of missing out.”
The increase in speculative risks, combined with excess leverage, leave the markets vulnerable to a sizable correction at some point in the future. The only missing ingredient for such a correction currently is simply a catalyst to put “fear” into an overly complacent marketplace.
In the long term, it will ultimately be the fundamentals that drive the markets. Currently, the deterioration in the growth rate of earnings, and economic strength, are not supportive of the current levels of asset prices or leverage. The idea of whether, or not, the Federal Reserve—along with virtually every other central bank in the world—is inflating the next asset bubble is of significant importance to investors who can ill afford to, once again, lose a large chunk of their net worth.
It is all reminiscent of the market peak of 1929 when Dr. Irving Fisher uttered his now famous words: “Stocks have now reached a permanently high plateau.” The clamoring of voices proclaiming the bull market still has plenty of room to run is telling much the same story. History is replete with market crashes that occurred just as the mainstream belief made heretics out of anyone who dared to contradict the bullish bias.
It is critically important to remain as theoretically sound as possible. The problem for most investors is their portfolios are based on a foundation of false ideologies. The problem is when reality collides with widespread fantasy.
Does an asset bubble currently exist? Ask anyone and they will tell you “NO.” However, maybe it is exactly that tacit denial which might just be an indication of its existence.
Positioning Review
While many will consider the commentary above “bearish,” followed by the assumption that our portfolios are not invested and we are somehow “missing out” on the advance, let me assure you such is not the case.
Our existing client portfolios are fully allocated to the market in accordance with their model allocations. New client portfolios are being slowly allocated into their models as the market breaks out of consolidation levels to new highs.
All accounts have had stop limits raised to current running support trend lines.
The current advance continues to remain intact despite a lack of legislative action, weaker economic and inflationary data and less than inspiring forward guidance on the earnings front.
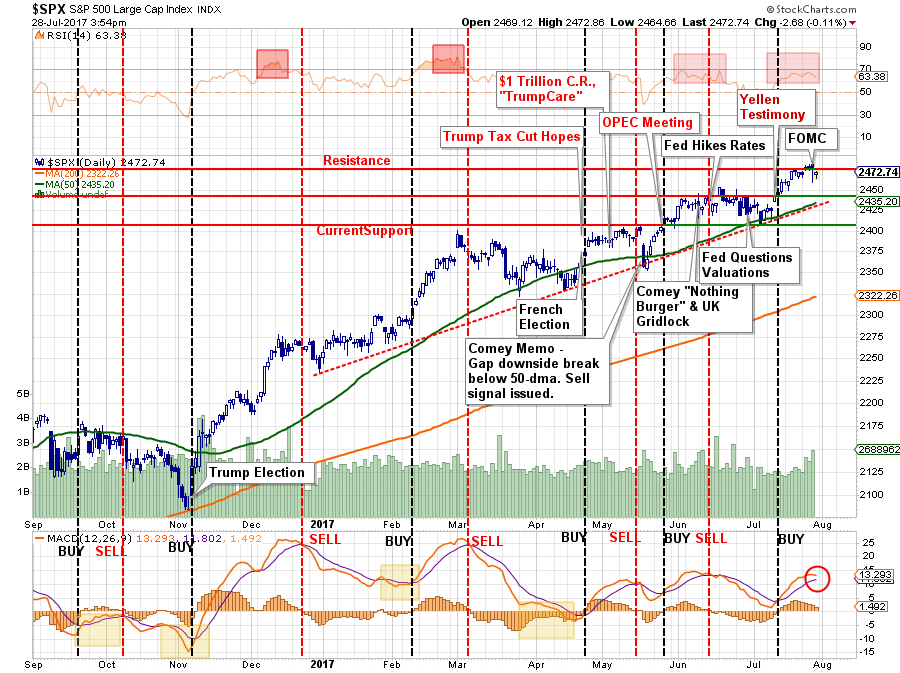
As shown in the bottom part of the chart above, on a very short-term basis the market currently remains on a “buy signal,” however, the weakness of the market over the last couple of days has led to some deterioration. Furthermore, the market is struggling with recent resistance levels as the overbought condition continues to limit the advance.
If the market can pull back to support, and work off some of the overbought condition without triggering a broader “sell signal,” we will add exposure to client portfolios.
We remain cautious, however, on the type of “risks” we take on in portfolios. Capital preservation always remains our priority over chasing returns.
As we have stated many times:
“Making up a missed opportunity is easy, replacing lost capital is impossible.”
Remember, you can always grow your invested capital back, but you can never replace the lost “time” in doing so. This is why “dollar cost averaging” and “buy and hold” investing leave investors short of their retirement goals over long periods of time.
Market and Sector Analysis
Data Analysis Of The Market & Sectors For Traders
S&P 500 Tear Sheet
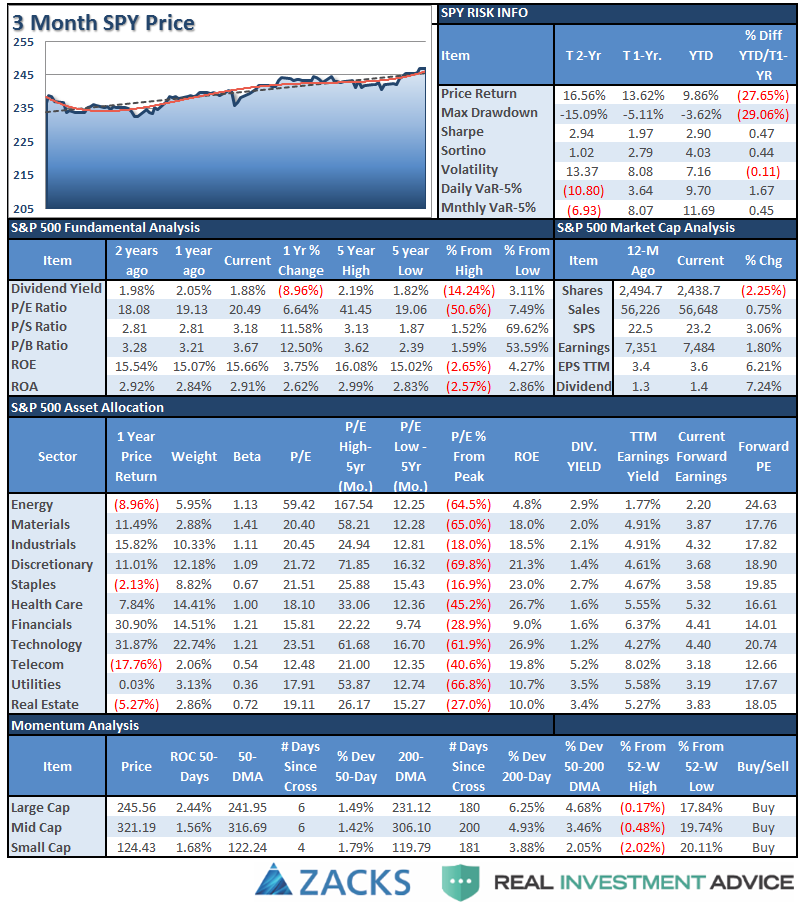
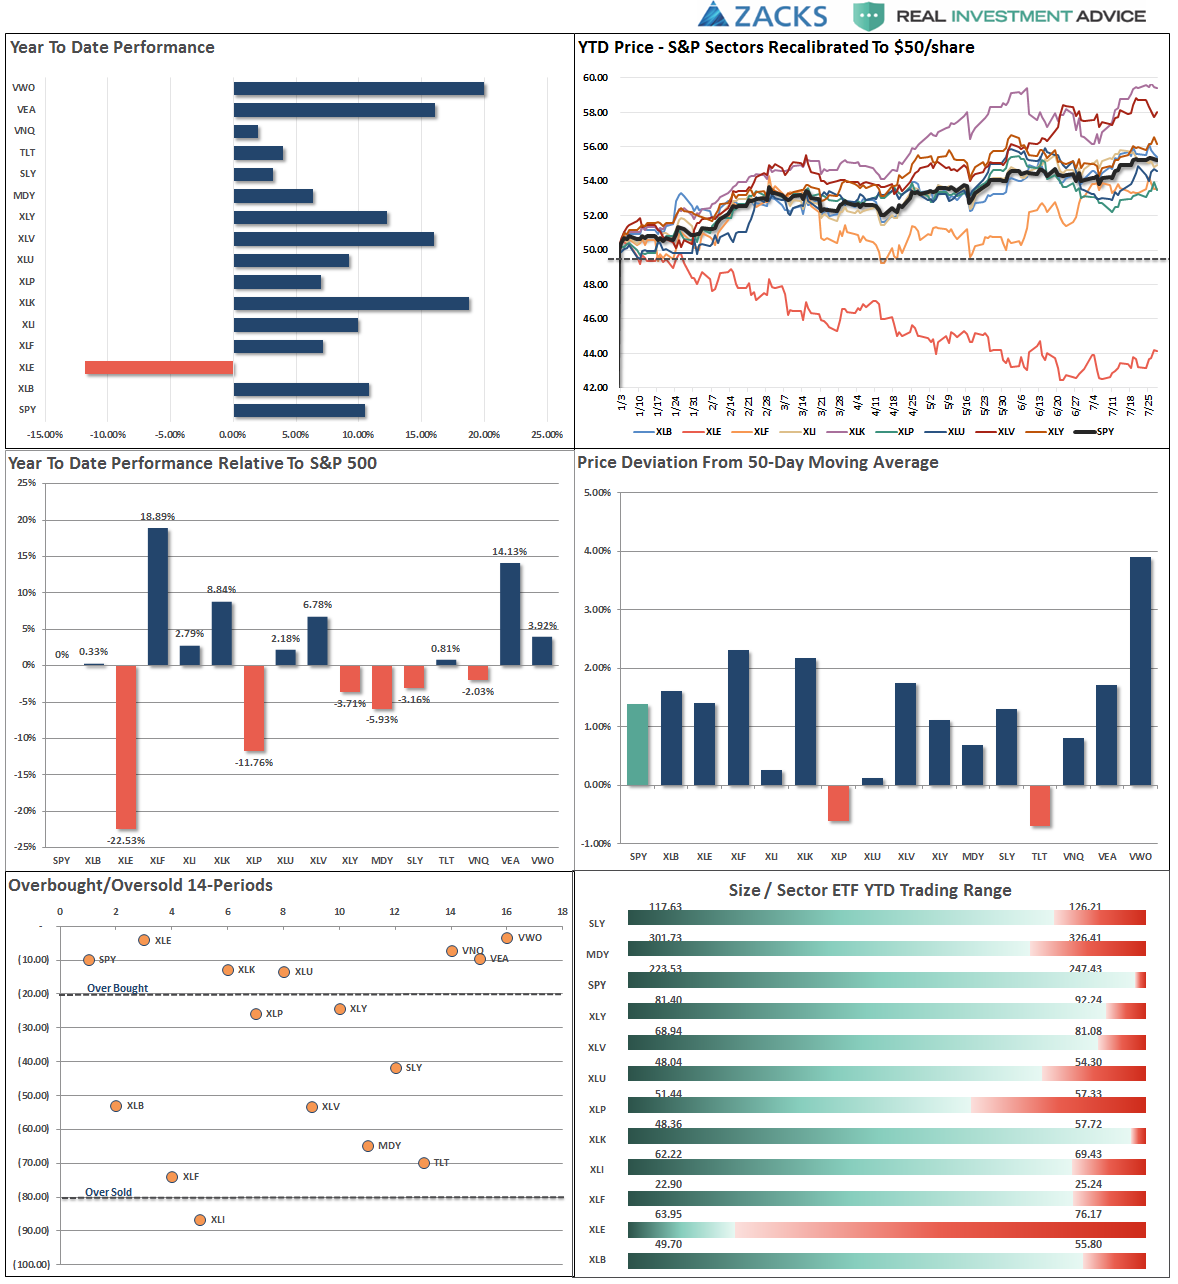
Performance Analysis
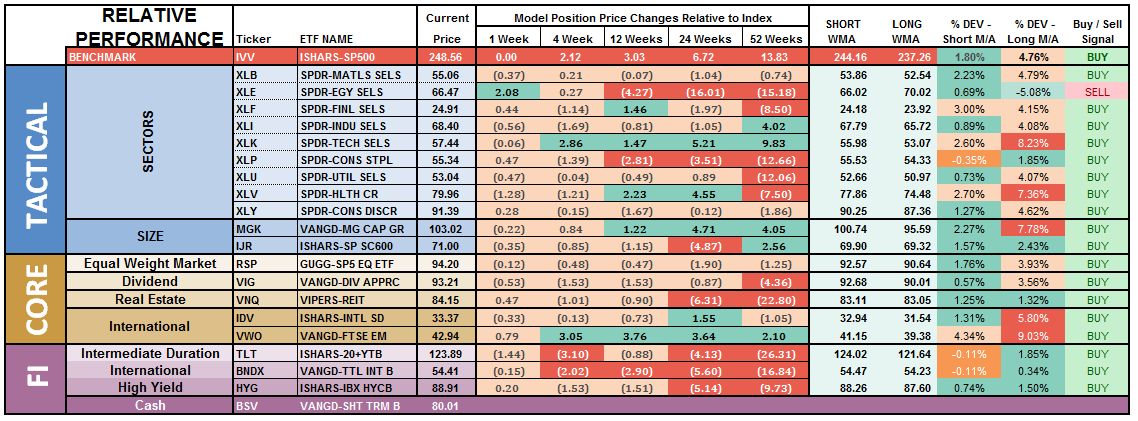
ETF Model Relative Performance Analysis
Sector Analysis:
This past week, the markets struggled with recent highs as tight trading ranges with limited drawdowns have been commonplace. Not much changed this week from last week, but groupings of sectors, in terms of relative performance, have become much tighter.
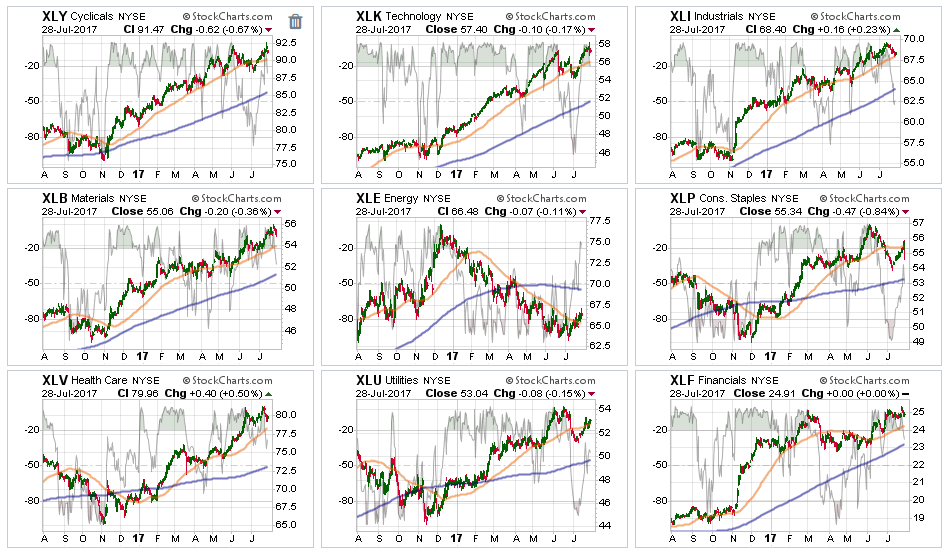
Healthcare, Materials, Financials, and Industrials continued to perform better this week relative to the S&P 500 index itself. However, that outperformance is beginning to show signs of deterioration.
Staples, Utilities, Technology, and Discretionary were weaker on a relative basis but are still holding bullish trends so nothing much to worry about at this juncture other than just tightening up stop levels and watching sector rotation and leadership changes.
Energy – wait…WHAT IS THAT? Over the last few months, I have been discussing the declining trend of energy stocks due to the weakness in oil prices. With both extremely oversold, we finally saw a rash of short-covering this past week pushing both the commodity and energy sector higher.
It is still TOO early to institute positions in oil as we need to see oil prices stabilize above $48/bbl. Also, estimates for energy companies are being rapidly slashed for the rest of the year so we need to see stabilization there as well. However, with that said, energy is back on the radar for a potential entry point. Let’s give it another week and reassess our positioning next week.
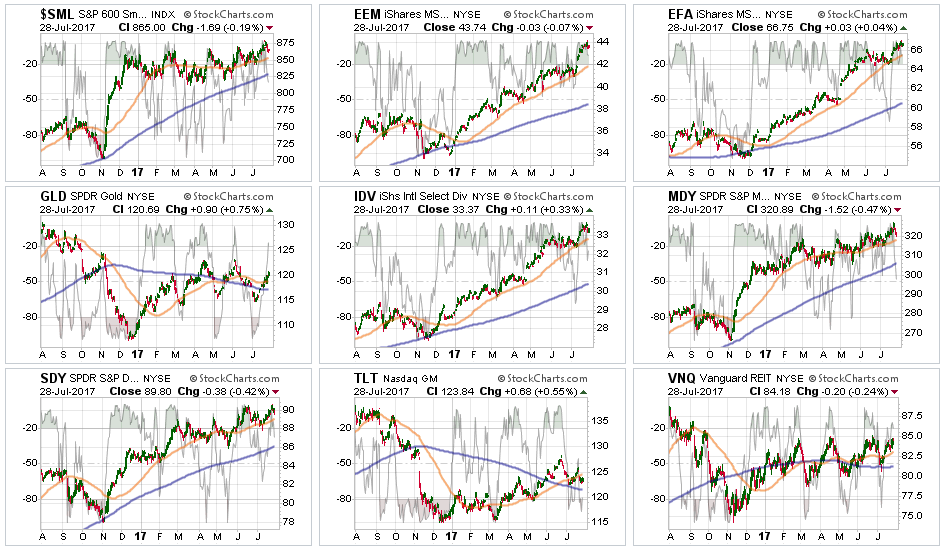
Small and Mid-Cap stocks continued to gain ground on performance relative to the S&P 500 index which keeps positions long in portfolios. Hold current positions and move stops up to the moving averages.
Emerging Markets and International Stocks as noted two week’s ago the bullish “buy point” occurred which allowed us to add international exposure to portfolios. However, the subsequent explosion of these sectors higher reduces the opportunity somewhat until there is some correction to work off the excessive overbought condition. That has not occurred currently, continue to be patient for a better entry point.
Gold – is once again trying to muster a rally from extremely oversold conditions. There is a good bit of work to do before this sector becomes interesting, but the move last week (via SPDR Gold Shares (NYSE:GLD)) above the 200-dma does put the commodity back onto our radar for now.
S&P Dividend Stocks (via IDV and SDY), after adding some additional exposure recently we are holding our positions for now with stops moved up to recent lows. With the sector becoming overbought, wait to add new exposure until a better opportunity presents itself.
Bonds and REITs both took a hit, but recovered a bit, from a rather surprising spike in rates. With inflationary pressures declining on every front, the most likely path for rates is lower. The drop in bond prices back to support can allow for adding bond exposure to portfolios if needed. Any push back towards 2.4% continues to be an ideal zone to add bonds and REIT’s to portfolios.
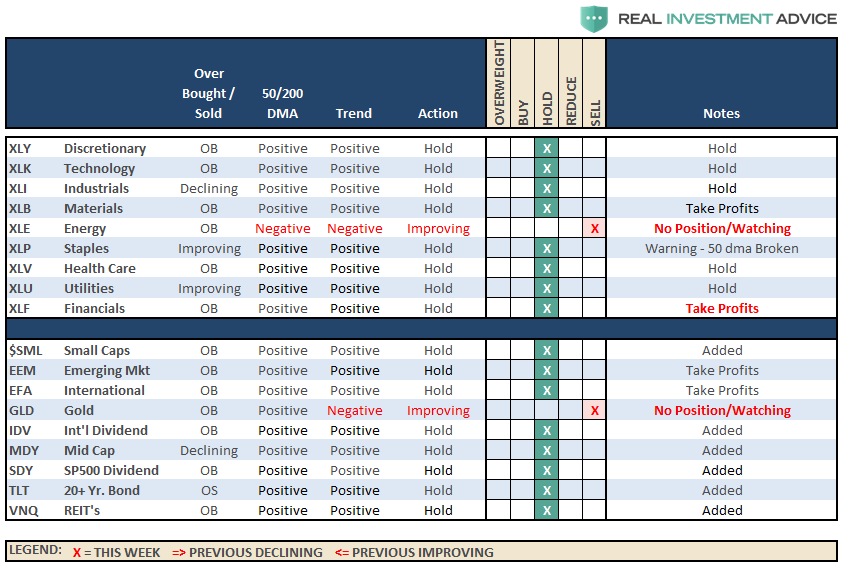
The table below shows thoughts on specific actions related to the current market environment.
(These are not recommendations or solicitations to take any action. This is for informational purposes only related to market extremes and contrarian positioning within portfolios. Use at your own risk and peril.)
Portfolio Update:
The bullish trend remains positive, which keeps us allocated on the long side of the market for now. However, more and more “red flags” are rising which suggests a bigger correction may be in the works over the next couple of months.
Several weeks ago, during the correction, we added modestly to our core holdings for the second time this year. Then, with the breakout of the market week before last, we added further to our portfolio positions and increasing exposure again. We also added to our bond holdings as well as rates hit our buy targets.
Stops have been raised to trailing support levels and we continue to look for ways to “de-risk” portfolios at this late stage of a bull market advance.
We remain invested. We just remain cautious and highly aware of “risks” to capital.
