As we get into the midst of the Q2 earnings season, we can take a closer look at the results through the 1st quarter of the year. Despite the exuberance from the media over the “number of companies that beat estimates” during the most recent reported period, 12-month operating earnings per share rose from $106.26 per share in Q4 of 2016 to $111.11 which translates into an increase of 4.56%. While operating earnings are widely discussed by analysts and the general media; there are many problems with the way in which these earnings are derived due to one-time charges, inclusion/exclusion of material events, and outright manipulation to “beat earnings.”
Therefore, from a historical valuation perspective, reported earnings are much more relevant in determining market over/undervaluation levels. It is from this perspective the news improved as 12-month reported earnings per share rose from $94.55 in Q4 of 2016 to $100.29, or 6.07% in Q2.
However, despite the improvement in reported earnings for the quarter, the thing that jumped out was the decline in revenues which slumped from $301.12/share in Q4 to $292.78/share in Q1. This was a decline of -2.77% for the quarter.
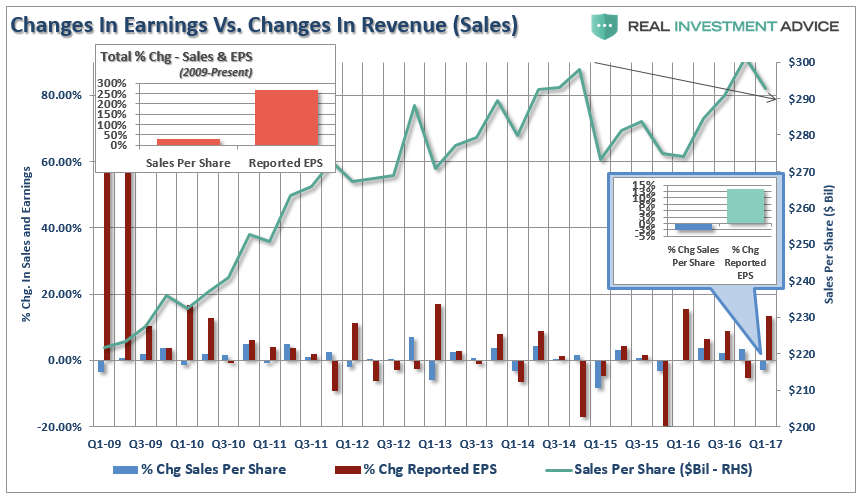
In other words, while top line SALES fell, bottom line revenue expanded as share buybacks and accounting gimmickry escalated for the quarter.
Earnings Manipulation Reaching Limits
There is no arguing corporate profitability improved in the first quarter as oil prices recovered. The recovery in oil prices specifically helped sectors tied to the commodity such as Energy, Basic Materials, and Industrials. However, such a recovery may be fleeting as the dollar remains persistently strong which continues to weigh on exports and the recovery in oil prices continues to remain muted.
Furthermore, as stated previously, the decline in oil prices during Q2 puts earnings estimates at risk. To wit:
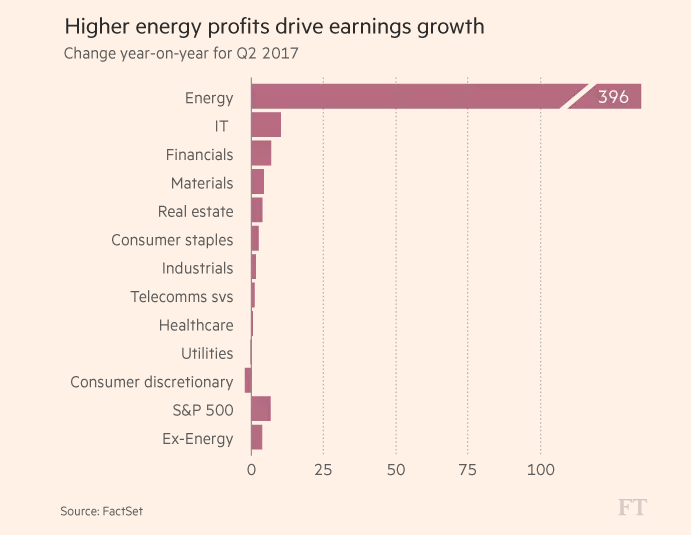
“First, with respect to oil, the bounce in oil following the crash in prices that began in 2014 resulted not only in the bulk of the decline in earnings initially but also the recovery in earnings with the bounce. However, that bounce has now faded but forward earnings expectations have likely not been revised lower. Per FactSet, the energy sector is expected currently to post a 396% gain in earnings on a year-over-year basis. Given the recent fall in oil prices, there is a huge risk of disappointment.”
“The biggest issue facing S&P 500 earnings going forward is the analyst community’s ‘miss’ on oil price estimates for the bulk of 2017, not just the second quarter. According to FactSet’s estimates, analysts are expecting the following average prices per barrel for WTI crude for the yet-to-be-reported final three-quarters of 2017:
- 2Q17: $51.96
- 3Q17: $54.29
- 4Q17: $55.72
With oil prices closer to $45 than $50, this could be a problem as, according to FactSet, analysts made the smallest cuts to Q2 earnings-per-share estimates in three years ahead of the reporting season.”
A secondary risk is in the rise in “profitability” since the recessionary lows which has come from a variety of cost-cutting measures and accounting gimmicks rather than actual increases in top line revenue. As shown in the chart below, there has been a stunning surge in corporate profitability despite a lack of revenue growth.
Since 2009, the reported earnings per share of corporations has increased by a total of 265%. This is the sharpest post-recession rise in reported EPS in history. However, that sharp increase in earnings did not come from revenue which is reported at the top line of the income statement. Revenue from sales of goods and services has only increased by a marginal 32% during the same period.
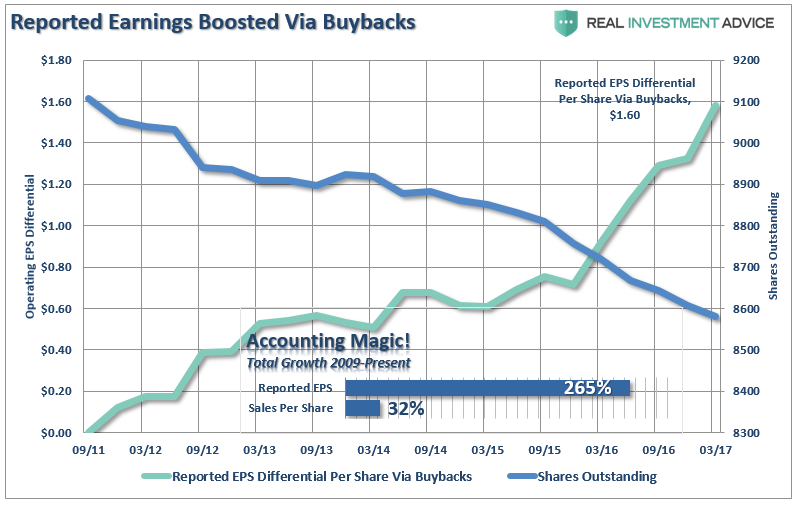
In order for profitability to surge, despite rather weak revenue growth, corporations have resorted to four primary weapons: wage reduction, productivity increases, labor suppression and stock buybacks. The problem is that each of these tools creates a mirage of corporate profitability which masks the real underlying weakness of the overall economic environment.
One of the primary tools used by businesses to increase profitability has been the accelerated use of stock buybacks. The chart below shows the total number of outstanding shares as compared to the difference between operating earnings on a per/share basis before and after buybacks.
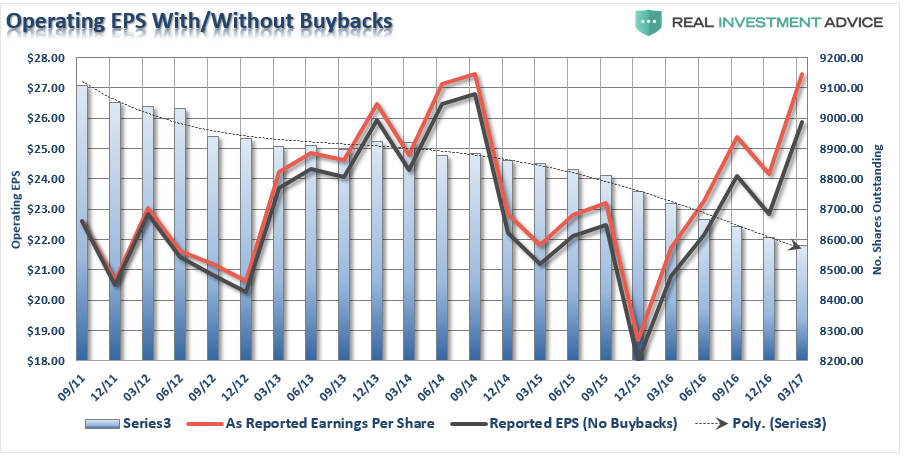
The reality is that stock buybacks create an illusion of profitability. If a company earns $0.90 per share and has one million shares outstanding – reducing those shares to 900,000 will increase earnings per share to $1.00. No additional revenue was created, no more product was sold, it is simply accounting magic. Such activities do not spur economic growth or generate real wealth for shareholders. However, it does provide the basis for with which to keep Wall Street satisfied and stock option compensated executives happy.
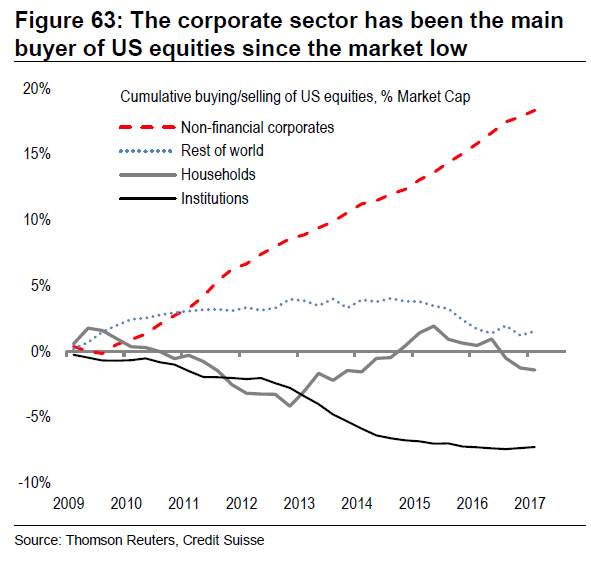
It is also worth noting that debt funded stock buybacks have been the primary source of stock purchases since 2009. To wit:
“In fact, according to a chart from Credit Suisse (SIX:CSGN), Fink may be more correct than he even knows. As CS’ strategist Andrew Garthwaite writes, ‘one of the major features of the US equity market since the low in 2009 is that the US corporate sector has bought 18% of market cap, while institutions have sold 7% of market cap.’
What this means is that since the financial crisis, there has been only one buyer of stock: the companies themselves, who have engaged in the greatest debt-funded buyback spree in history.”
Ultimately, the problem with cost cutting, wage suppression, labor hoarding and stock buybacks, along with a myriad of accounting gimmicks, is that there is a finite limit to their effectiveness. Eventually, you simply run out of people to fire, costs to cut and the ability to reduce labor costs.
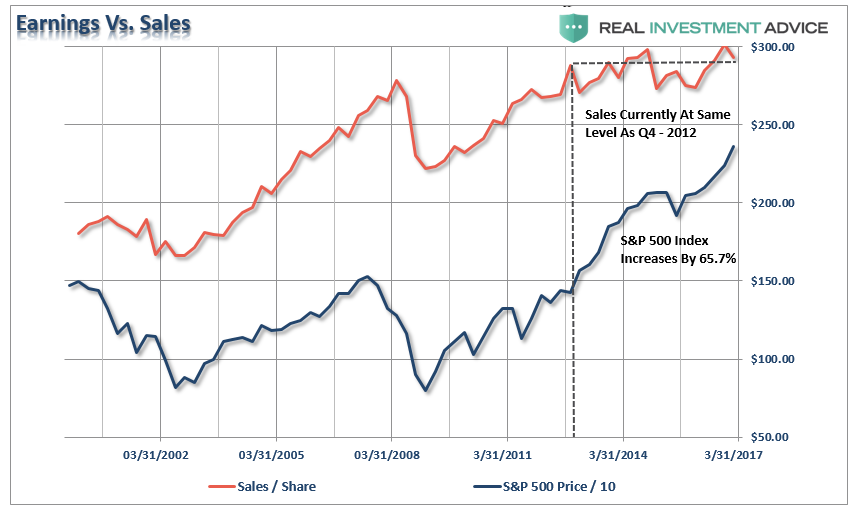
Lastly, there is also the problem of the long-term relationship between stocks prices and underlying fundamentals. While there is much hope that earnings will eventually play “catch up” to stock prices, there is a significant risk to that outcome. As shown below, sales per share is roughly at the same level as it was in Q4-2012, but stock prices have risen by 65.7% during the same period. With stock prices already “priced to perfection,” any shortfall will likely be problematic.
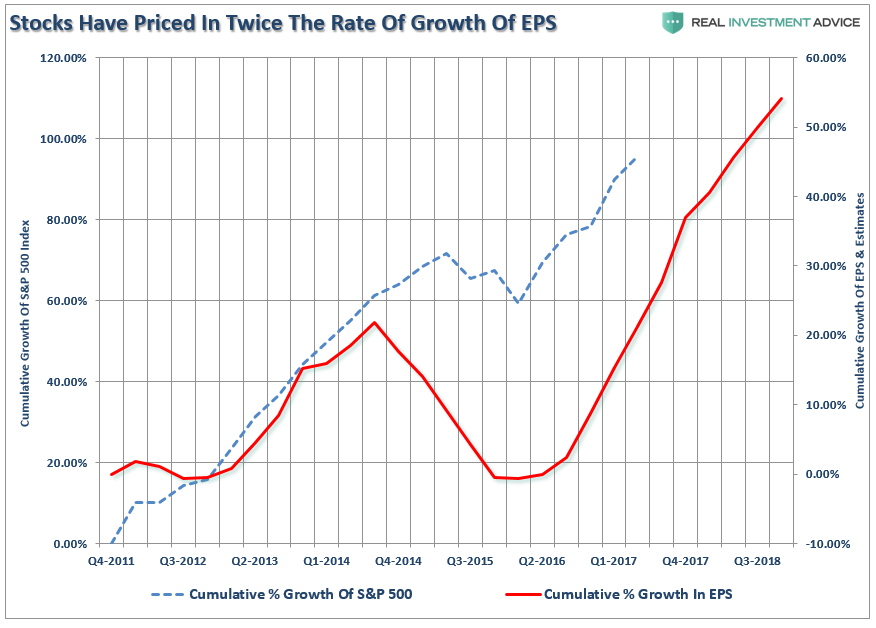
The same phenomenon also appears at the bottom line of the income statement with earnings per share. Once again, the market has already priced in earnings growth through 2018.
Considering that forward estimates are generally overstated by 33% on average, the risk is high of disappointment. As shown below, there was a $10 difference between what earnings were expected to be in 2017 at the beginning of 2016 and today. Furthermore, forward earnings have only risen by $4.15/share for the end of 2018. Yet, as shown, above prices have more than priced in that future growth.
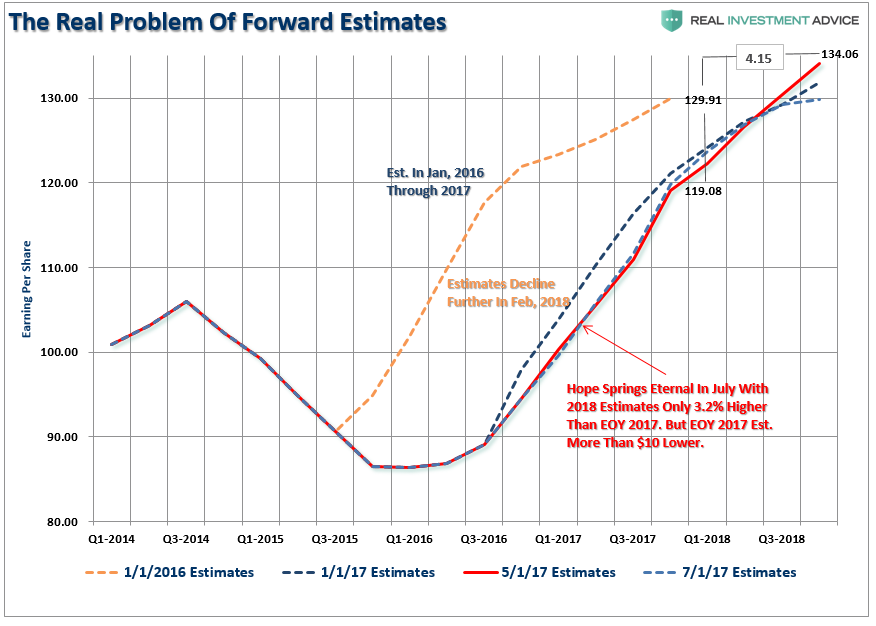
With analysts once again hoping for a “hockey stick” recovery in earnings in the months ahead, it is worth noting this has always been the case. Currently, there are few, if any, Wall Street analysts expecting a recession at any point the future. Unfortunately, it is just a function of time until the recession occurs and earnings fall in tandem.
There is virtually no “bullish” argument that will currently withstand real scrutiny. Yield analysis is flawed because of the artificial interest rate suppression. It is the same for equity risk premium analysis. Valuations are not cheap, and any increase in interest rates by the Fed will only act as a further brake on economic growth.
However, because optimistic analysis supports our underlying psychological “greed”, all real scrutiny to the contrary tends to be dismissed. Unfortunately, it is this “willful blindness” that eventually leads to a dislocation in the markets.
