Will 2018 Be The Year Bitcoin Will Want To Forget?
Following US banks, Lloyds Bank has become the latest UK bank to ban Bitcoin purchases using credit cards.
If 2017 was the year of Bitcoin, when it rose from roughly $800 to $19,891 by mid-December, 2018 so far is looking more and more like the year Bitcoin traders may want to forget. As of 05:42 EST, the most popular digital currency is down 37 percent for the year and down a mind-boggling 60 percent from its December 17 high of $19,891.
If it took regulators something like two decades to regulate retail forex and five years to shut down binary options, they can't afford a third screw-up. It's understandable that Bitcoin's unprecedented volatility and quick and sharp declines make banks leery of being left holding the (empty) bag.

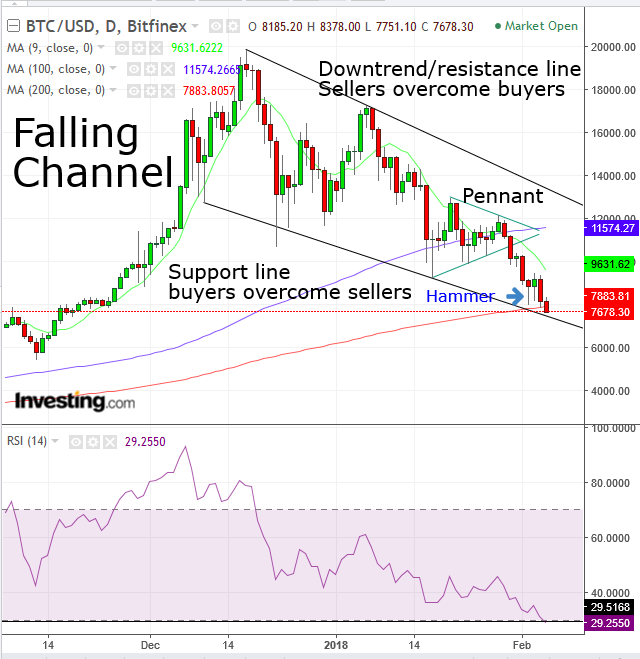
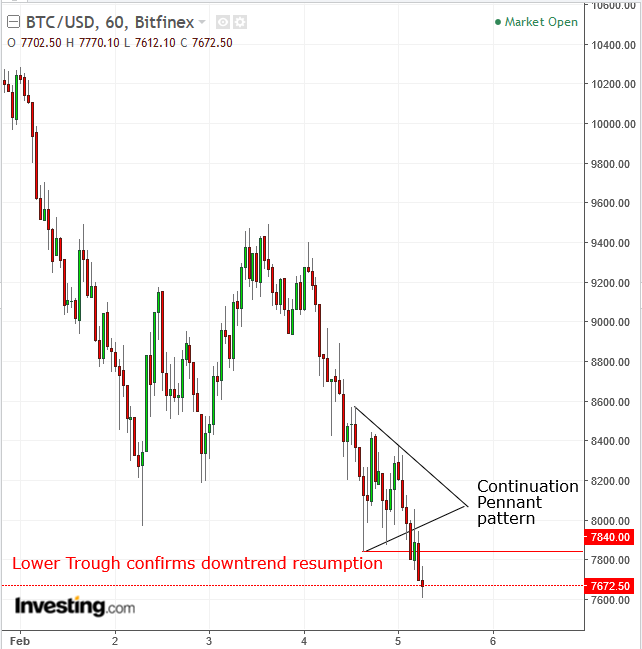
Technically, Bitcoin posted a new trough on Thursday, solidifying the downtrend upon the completion of a continuation pennant pattern, which is bearish within a downtrend, with an implied target of mid-$6,000 levels.
However, having reached a quadruple support level, it is ripe for a corrective rebound.
Quadruple Support Level
- 29.18 RSI level, the most oversold since August 2016
- Friday’s bullish hammer
- 200 dma (red)
- Channel bottom, where buyers have overcome sellers since December 9
Moving Average Analysis
Moving averages are statistical trendlines of different periods; 17 hours ago, the 50 dma (green) aligned with the channel top, the 100 dma (blue) ran through the pennant’s apex, and the 200 dma (red) guarded the channel bottom and Friday’s hammer.
Today, after the UK's Lloyds Bank banned the use of credit cards for Bitcoin purchases, the price dipped below the 200 dma, causing a ripple effect in the moving-average fabric. The 50 dma rushed from the supply-demand pressure point of the channel top to the new one, right above the range since Friday.

A dip below the 200 dma may bounce, confirming its support. However, drilling down into the hourly view, the price has completed another bearish pennant, with an implied target of $7,200.
Trading Signals
Conservative traders are most likely to wait for a “bargain short” with a return move all the way to the daily chart's channel-top, followed by a bearish show of force, in confirming the downtrend line’s integrity, forming a long red candle, whose real body would engulf the preceding green candle.
Moderate traders may trade in the shorter term on the hourly chart, entering a short position upon a return move to confirm the pennant’s resistance and an open-to-close down-day whose price action is at least average since the breakout and covers the preceding open-to-close up day.
Aggressive traders may enter a contrarian long position, counting on both the daily oversold condition, potential latent support of the 200dma, hammer and channel bottom, compounded with a prevalent breakout return-move on the hourly chart.
