- Chinese-US trade tensions further spook markets
- Oil prices under pressure even after cuts agreement
- Yield and dollar rebound
- The U.K. House of Commons is set to vote on the EU divorce deal on Tuesday, with Prime Minister Theresa May confronted by opponents within her own Conservative Party.
- The European Central Bank is set to cap asset purchases at its final policy meeting of 2018 on Thursday.
- China industrial production, retail sales data for November is due Friday.
- Futures on the S&P 500 Index decreased 0.2 percent as of 8:03 a.m. London time, hitting the lowest in more than two weeks with their fifth consecutive decline.
- The STOXX 600 declined 0.6 percent.
- The MSCI All-Country World Equity Index Index dipped 0.4 percent, hitting the lowest in almost 16 months with its fifth consecutive decline.
- The MSCI Emerging Markets Index fell 1.2 percent to the lowest in more than two weeks.
- The Bloomberg Dollar Spot Index declined 0.1 percent to the lowest in more than two weeks.
- TheEUR/USD gained 0.4 percent to $1.1429, the strongest in three weeks on the biggest climb in more than a week.
- The Japanese USD/JPY increased 0.1 percent to 112.63 per dollar, the strongest in three weeks.
- The British GBP/USD climbed less than 0.05 percent to $1.2728.
- The MSCI Emerging Markets Currency Index fell 0.4 percent to the lowest in more than a week.
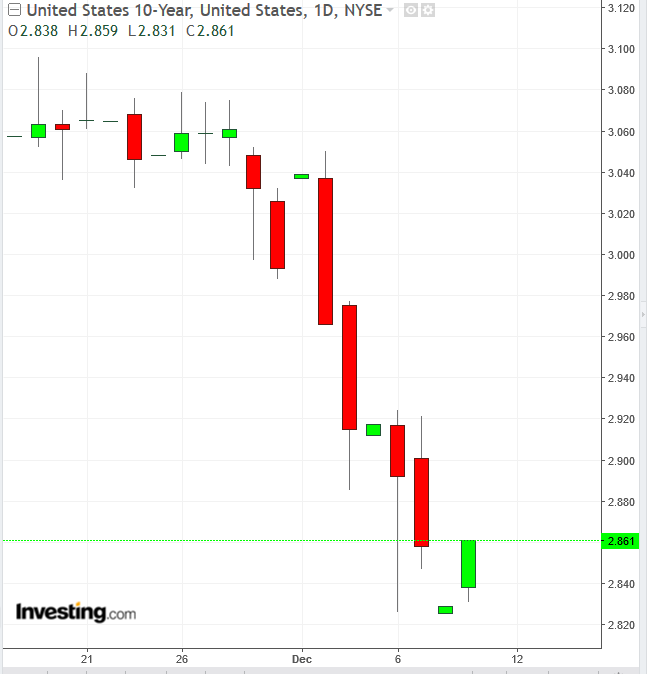
- The yield on 10-year US climbed one basis point to 2.85 percent, the most significant increase in two weeks.
- Germany’s 10-year yield decreased less than one basis point to 0.25 percent.
- Britain’s 10-year yield declined one basis point to 1.254 percent.
- The spread of Italy’s 10-year bonds over Germany’s advanced four basis points to 2.9232 percentage points.
- The Bloomberg Commodity Index climbed less than 0.05 percent to the highest in three weeks.
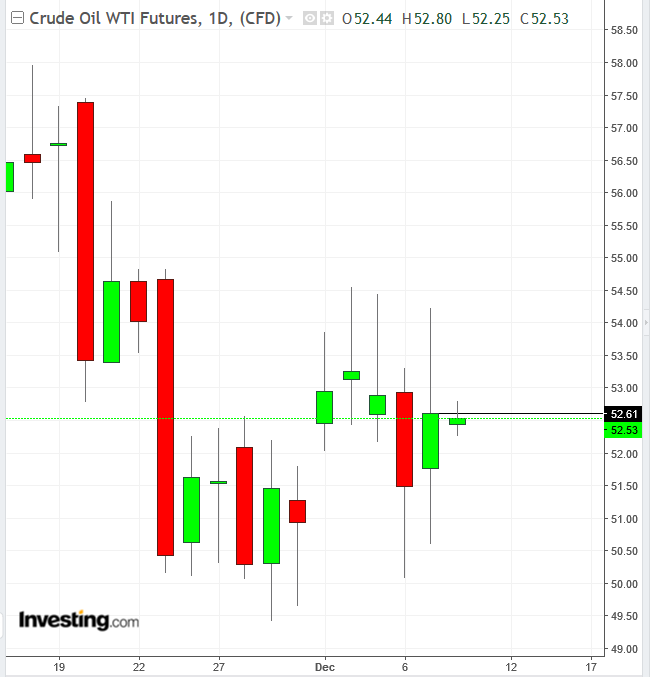
- West Texas IntermediateCrude Oil WTI Futures declined 0.1 percent to $52.55 a barrel.
- LME copper fell 0.4 percent to $6,122.00 per metric ton.
- Gold Futures declined 0.1 percent to $1,247.95 an ounce, the largest drop in more than a week.
European equities and US futures took their cues from Asia's declines as simmering Sino-U.S. trade tensions and China's economic slowdown were in focus.
The Stoxx Europe 600 Index reversed Friday's gain and fell to its lowest level since early December 2016, wiping out the rally that followed the US presidential election. Miners and energy underperformed amid falling oil prices and fears of increases in tariffs.
In the Asian sessions, equities slumped on weaker than expected Chinese import and export data, which followed a soft U.S. employment report. Japan's GDP shrank at an annualized rate of 2.5% in the third quarter, adding to investor concerns.
China Shanghai Composite was among the region's best performers, falling only 0.82 percent, as bargain hunters apparently moved in.
Australian shares were the region's underperformer, declining 2.12 percent, weighed down by healthcare and financials. China is Australia's largest trading partner. The S&P/ASX 200 index fell to the lowest since December 2016.
On Friday, US stocks indexes plunged, finishing off one of their worst weeks since March. The S&P 500 index fell 4.6 percent for the week.
Drivers ranged from persistent trade tensions -- the arrest of the chief financial officer of Chinese smartphone maker Huawei Technology Co Ltd (SZ:002502) for possible extradition to the United States was seen as exacerbating those tensions - to an employment report that missed estimates and a flattening yield curve that is seen as a precursor to the end of the bull market.
While a yield curve projects how bankers view the market, it historically proceeds a recession by a year to two, suggesting there may still be life in the market. Also, even with the disappointing job headline, unemployment held its 49-year low and wages, which support the consumer spending that makes up two-thirds of the U.S. economy, matched projections on an annual basis.
Still, the technical picture raises red flags, as medium-term uptrend lines were violated, and death crosses triggered. While not for the weak of heart, the most significant opportunities can be found when others lose hope and sell at bargain prices.
10-Year Yield Daily Chart

10-year yields which slumped after the disappointing job results have rebounded to under 2.9.
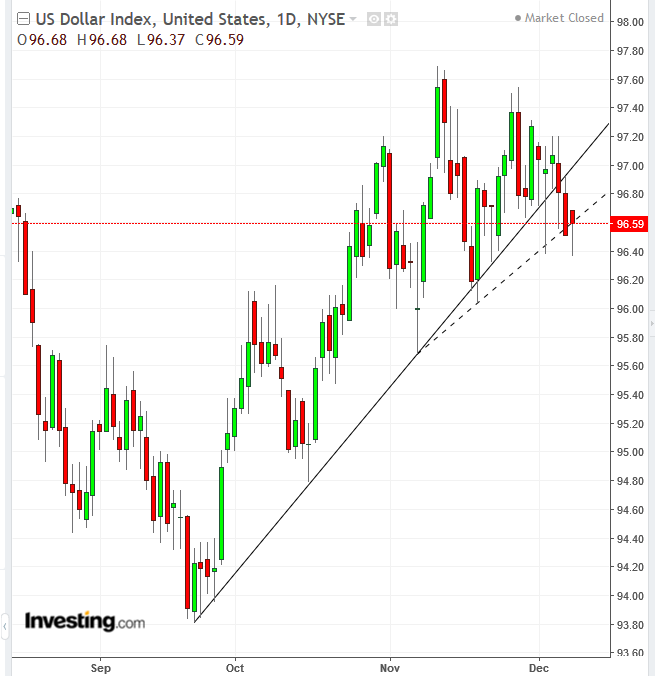
DXY Daily Chart

The rising yields pulled the dollar up. While the dollar is still below its uptrend line since September 21, it has been forming a hammer, confirming the short-term uptrend line since November 7.
WTI Daily Chart

Oil is under pressure even after Friday’s rally triggered by OPEC and its allies agreeing on production cuts.
Up Ahead
Market Moves
Stocks
Currencies
Bonds
Commodities
