Key Events
Futures on the S&P 500, Dow and NASDAQ 100 tracked global stocks higher this morning after China set the yuan at a stronger fixing, easing fears of trade war escalation.
All four major U.S. contracts rose for the third day after U.S. stocks posted a late miraculous recovery on Wednesday after a tumultuous session.

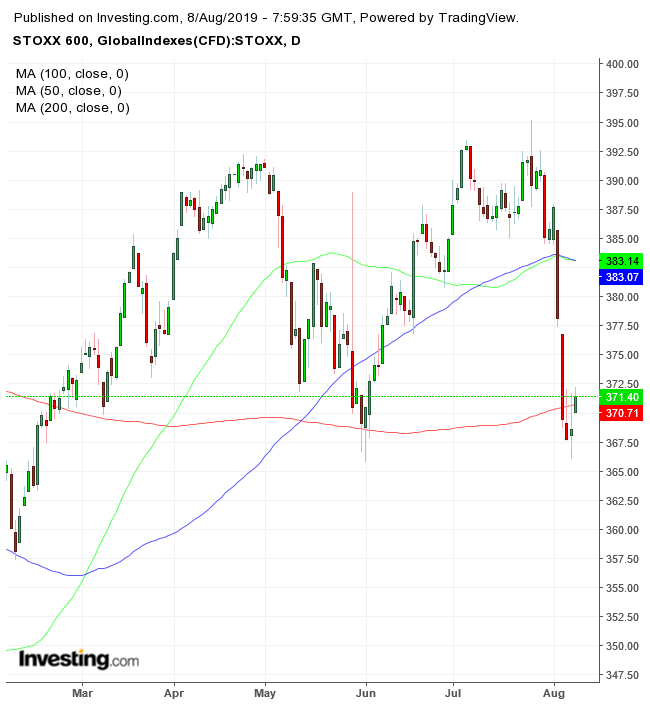
Europe's STOXX 600 climbed for the second day with technology and healthcare shares. The index's price is back above the 200 DMA after closing below it— on Monday and Tuesday—for the first time since Sep. 28, 2018, when it proceeded to plunge 13% in the three months to Dec. 27. Currently, the price is struggling with Tuesday’s and Wednesday’s highs, after those days' lows retested the June trough. If the price falls lower than 366.00, it will complete a double top.
In the earlier Asian session, equities enjoyed widespread gains after Beijing daily currency fix was firmer than anticipated. Still, the renminbi remains weaker than 7.000 per dollar—for the first time since the financial crisis—for the fourth session, perhaps due to technical drivers. After the U.S. administration named China a currency manipulator, the Asian country blamed the yuan's moves on U.S. policies and trade rhetoric, which it said unsettled markets and spurred a selloff that led to pronounced depreciation.
Global Financial Affairs
Also helping equity prices higher, starting from the forceful reversal in the U.S. session: data showing Chinese exports grew the most since March, expanding 3.3% last month on a year-on-year basis, smashing expectations for a 2% contraction. Imports, however, slid 5.6%, boosting worries over falling demand—but averted the steeper 8.3% plunge that had been forecast, thereby enabling investors to preserve the rally.
China’s Shanghai Composite rebounded 0.93% from the lowest level since February, outperforming its regional peers but remaining well below a dual resistance of a breakaway gap and the 200 DMA.

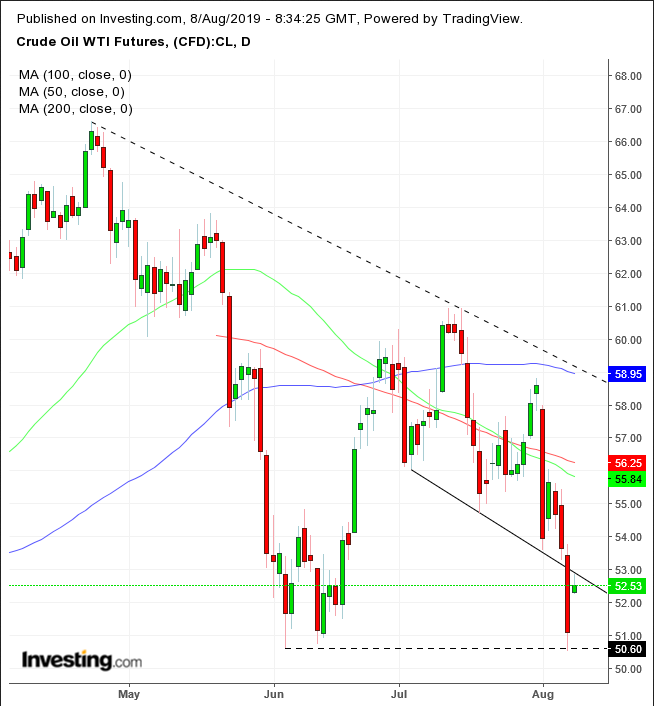
WTI leaped forward after reports Saudi Arabia officials were summoning other oil producers to discuss a market intervention and stabilize falling prices.
It’s noteworthy that any U.S.-China trade progress that recently propped equities up failed to drive oil higher, despite the fact trade jitters were what drove prices lower to begin with.
A OPEC-Russia intervention may also fall short of rescuing oil prices, which have fallen into bear-market territory and completed a H&S continuation pattern—both confirming the downtrend line since the beginning of the year and threatening a massive descending channel during the same timeframe. Should that materialize, it will prompt the completion of a H&S continuation pattern since July 2016—within the long-term trend—whose implied target will retest the Feb. 2016 lows of $26.

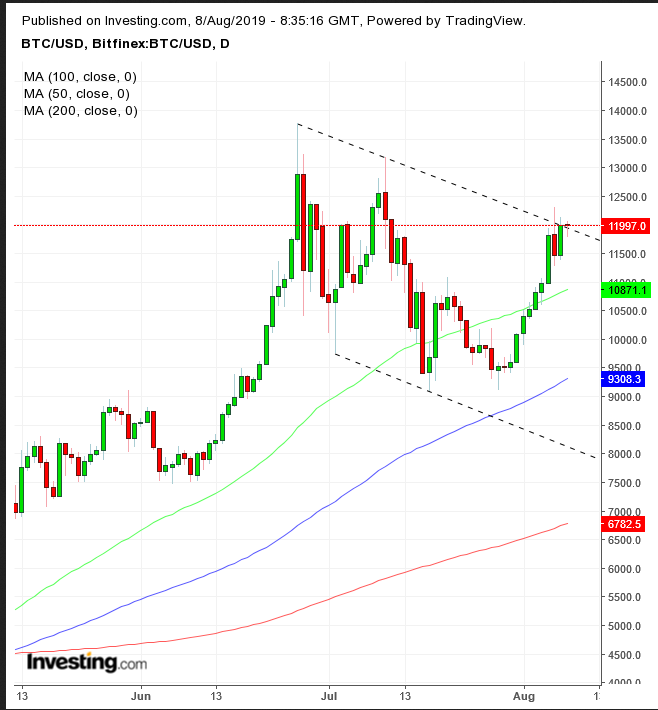
Bitcoin is retesting the top of a falling channel for the third day.
Up Ahead
Market Moves
Stocks
- The U.K.’s FTSE 100 gained 0.6%, the first advance in more than a week.
- Germany’s DAX climbed 1.4%, the biggest rise in more than a week.
- The MSCI Asia Pacific Index edged 0.3% higher, the largest rise in more than a week.
Currencies
- The Dollar Index fell 0.1%.
- The euro gained 0.1% to $1.1215, the strongest in two weeks.
- The British pound ticked 0.3% higher to $1.2177.
- The Japanese yen climbed 0.1% to 106.14 per dollar.
- The onshore yuan strengthened 0.2% to 7.044 per dollar.
Bonds
- The yield on 10-year Treasurys dropped less than one basis point to 1.73%.
- Britain’s 10-year yield gained one basis point to 0.525%, the biggest advance in more than a week.
- Germany’s 10-year yield climbed two basis points to -0.56%, the first advance in two weeks.
Commodities
- Gold gave up 0.2% to $1,498.35 an ounce.
- West Texas Intermediate crude gained 2.9% to $52.56 a barrel.
- Iron ore increased 2.1% to $90.92 per metric ton, the first advance in more than a week.
- LME nickel surged 5.8% to $15,670 per metric ton to the highest in 14 months.
