- Total U.S. unemployment expected to top 25 million as of today's Jobless Claims release
- Oil climbs for the third day but volatility could continue
Key Events
Though U.S. futures for the Dow Jones, S&P 500 and NASDAQ, as well as Asian indices, opened higher on Thursday after yesterday's strong Wall Street performance, contracts on the major U.S. benchmarks have now slipped lower. European shares, though still in the green at the time of writing, are also wavering, pressured by this morning's release of eurozone Manufacturing and Services PMI numbers which all dropped. The services release was especially abysmal across the region.
Investors are now bracing for today's U.S. Initial Jobless Claims data. As of last week's report, a total of 22 million Americans had filed unemployment claims over a three-week period; after today's print it's expected that number will climb to more than 25 million. As well, the number of reported, global COVID-19 cases continues to grow, currently topping 2,637,000 with close to 48,000 fatalities in the U.S. alone.
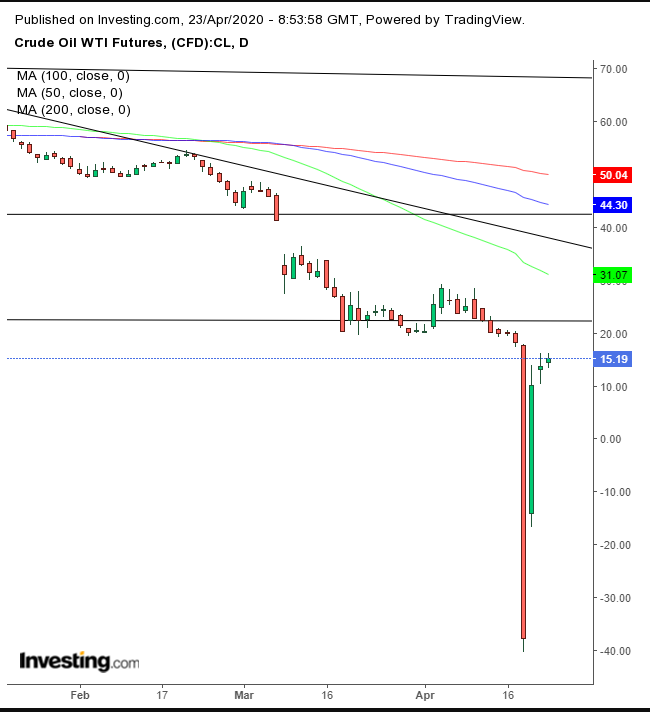
WTI extends a rebound from unprecedented negative prices earlier this week. The commodity has been fluctuating around $15.
Global Financial Affairs
While optimism among American investors over the past few weeks gave birth to a new bull market in record time, never-before-seen negative oil prices along with worries about the unpredictable results of this current earnings season after coronavirus shutdowns, paint a different picture.
Though oil may currently be trading higher, the extreme volatility seen over the past few days might not yet be over.

With prices currently hovering around the $15 level, we expect the $20 mark to provide staunch resistance.
Also, the Stoxx Europe 600 Index gave up an advance after Swiss investment bank Credit Suisse (SIX:CSGN), during today's earnings release, disclosed more than $1 billion in writedowns and provisions for bad loans due to the pandemic, offsetting its profit growth.
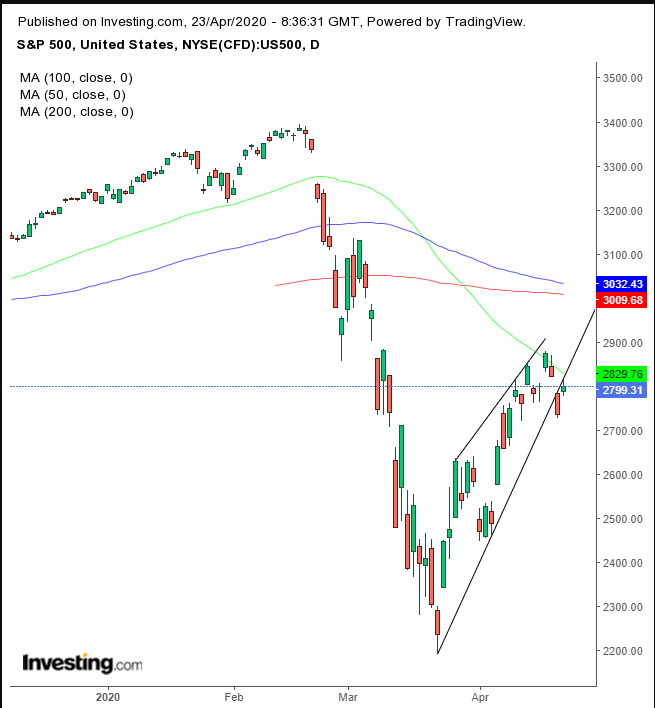
Earlier Thursday, Asian stocks finished mixed: Japan’s Nikkei 225 outperformed, (+1.52%) while China’s Shanghai Composite lagged, (-0.19%). Technically, most regional gauges have been developing patterns which have been congesting as they move higher, possibly forming rising wedges which are bearish after the preceding dramatic plunge.
The only anomaly is that this presumably bearish pattern developed along with the “fastest recovery in history.” Or could it be a classic 'bear trap' fueled by stimulus steroids?
Yesterday on Wall Street, American shares ended a two-day selloff. Bulls appeared to be feasting on the usual fodder of Trump administration optimism on the reopening of the economy and corporate results that were not uniformly dismal. Or at least not yet.
The S&P 500 Index bounced back from the worst decline in three weeks, as the not-as-bad-as-we-expected earnings results swung the pendulum of sentiment to the positive side.

The index rose to 2,799.31, gaining 2.3%. From a technical perspective, however, trading developed a weak candle stick, which failed to climb back above its uptrend line from the March 23 bottom. In addition, the same uptrend line might be the bottom of a slim rising wedge, a pattern presumed to be bearish as traders lose patience when prices don’t keep up their earlier velocity. Note, the 50 DMA—which recently fell below the 200 DMA, triggering the nefarious Death Cross—stopped prices in their tracks.
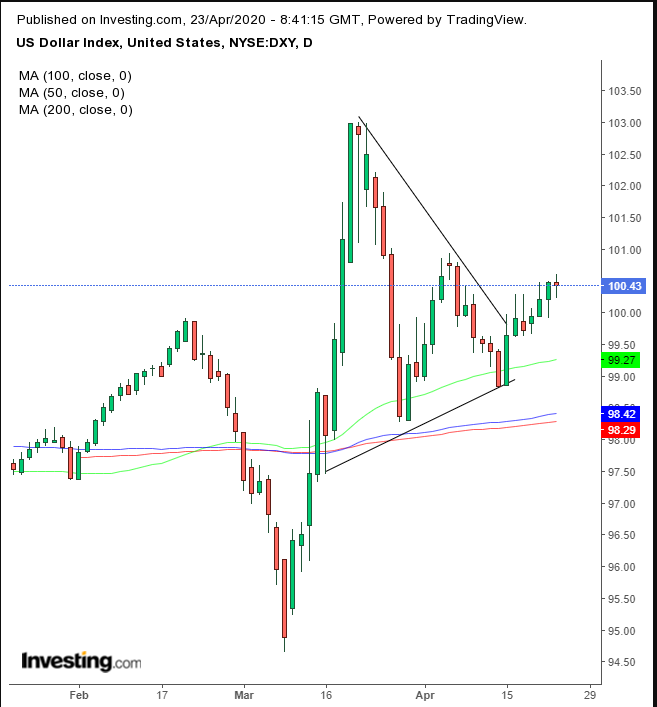
Yields, including for 10-year U.S. Treasury, drifted and the dollar was flat, as bulls took a breather after a three day advance.

Technically, it appears as if the greenback completed a symmetrical triangle. However, its exit via the apex—rather than an earlier outbreak—diminishes the view that bulls are resolute. This leaves technicians waiting for further clues to determine the supply-demand balance.
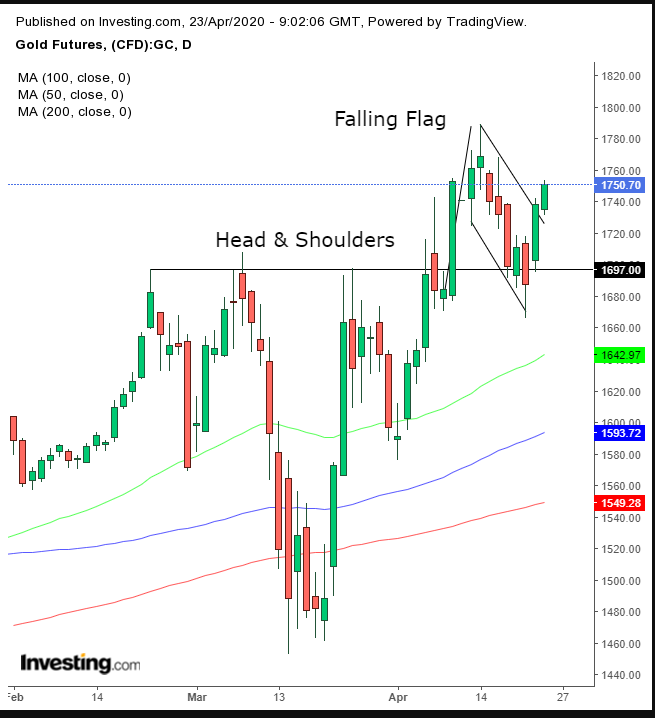
Gold bulls, though, left markets with no uncertainty today.

The precious metal extended a bullish pattern as prices move toward $1750.
Up Ahead
- Japan releases National Core CPI figures on Thursday evening; the March figure is anticipated to be 0.4%.
- Friday's U.S. Core Durable Goods Orders are expected to have dropped forcefully to -6.0% from -0.6%.
Market Moves
Stocks
- The Stoxx Europe 600 Index fell 0.2%.
- Futures on the S&P 500 Index declined 0.1%.
- The MSCI Asia Pacific Index climbed 0.7%.
- Japan’s TOPIX increased 1.4%.
Currencies
- The Dollar Index was flat.
- The euro dipped 0.3% to $1.0791.
- The British pound decreased 0.2% to $1.2314.
- The Japanese yen was little changed at 107.79 per dollar.
Bonds
- The yield on 10-year Treasuries advanced less than one basis point to 0.62%.
- Britain’s 10-year yield advanced less than one basis point to 0.331%.
- The Italy 10-year vs Germany 10-year spread decreased three basis points to 2.456 percentage points.
Commodities
- West Texas Intermediate crude increased 6.2% to $14.64 a barrel.
- Brent crude climbed 4.3% to $21.24 a barrel.
- Gold weakened 0.1% to $1,712.43 an ounce.
- Copper advanced 0.2% to $2.31 a pound.
