- Yesterday's US rally resumes this morning in Asia and Europe
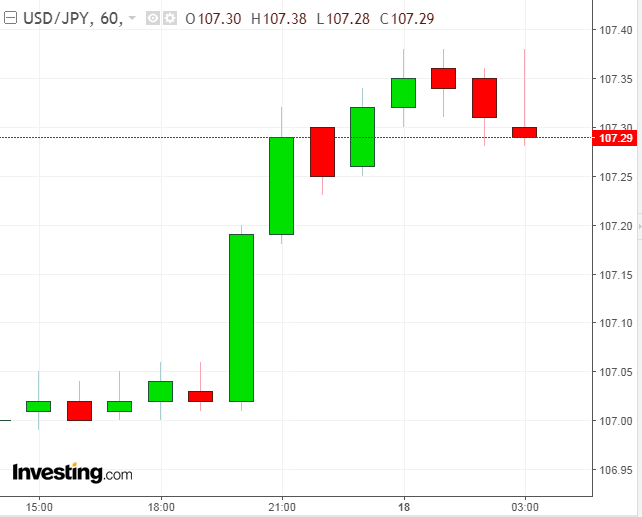
- Yen weakens on trade surplus miss
- TOPIX outperforms
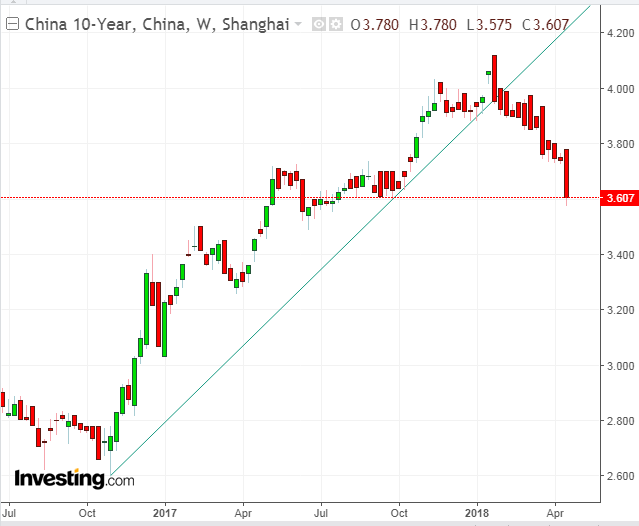
- PBoC cuts bank reserve requirements to support credit, amid crackdown; Chinese bonds fall
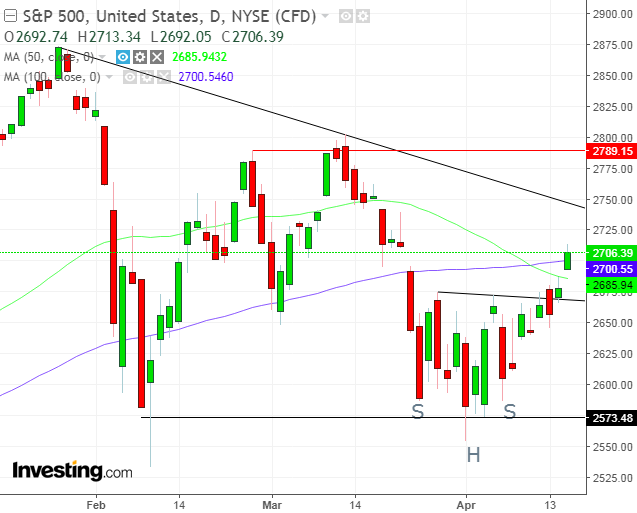
- Yesterday's US rally occurred on earnings, scoring multiple techinical advances; still some technicians are bearish
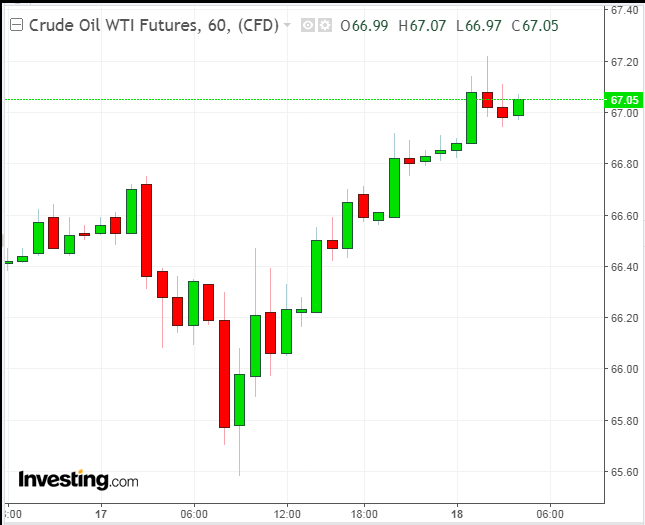
- Oil rebounds, even as stockpiles decline less than expected
Key Events
Stocks in Europe drifted higher this morning, following gains across Asian markets, as investors reclaimed their confidence as earnings season got off to a solid start. As well, signs of improving relations between the US and North Korea added to the returning risk-on mood. The Stoxx Europe 600 advanced for a fourth day and, as this writing, US futures are all trading higher: S&P 500 futures are currently up 0.26%; NASDAQ Futures have gained 0.33%; Dow futures are higher by 0.87% while Russell 2000 futures have jumped 1.06%.
Global Financial Affairs
Earlier today, Japan's TOPIX advanced 1.15 percent and closed at the top of the session. South Korea's KOSPI climbed less than 1.10, trimming a 1.35 percent advance. The S&P/ASX 200 underperformed, edging up just 0.35 percent, ending an advance beneath two consecutive shooting stars, confirming the resistance of the broken March support.
Chinese stocks—both on and off the mainland—oscillated widely between losses and gains during a volatile session. The Shanghai Composite opened 0.8 percent higher, dropped to a point where it was 0.8 lower, then settled at a 0.9 percent advance.
The trading pattern formed an extremely bullish hammer. However, after registering a 3041.53 trough, below the February 9, 3062.74 trough, the pattern completed a reversal from an up to a downtrend, since the January 29, 2587.03 peak.
Chinese lenders advanced after the PBoC lowered the reserve requirement ratio for banks. It's an effort to support credit while clamping down on shadow lending; it sent China's sovereign bond yields lower, including the 10-year, which tumbled 1.90%.
Shares of China’s automakers declined after government regulators moved to allow foreign players to take full ownership of their local ventures.
A weak yen helped boost Japanese shares. The JPY may have weakened as a result of disappointing import and ecl-995||export figures for March. Japan's softer than expected trade surplus occurred, ironically, on a stronger yen as well as concerns over the escalating trade war between the world's two biggest economies.
Should tensions increase, the first synchronized global growth since the 2008 financial crisis could slow, if not completely halt. The value of exports increased 2.1 percent in March from a year earlier, missing the 5.2 percent forecast by a mile. Imports fell 0.6 percent. They were expected to rise 6.3%, led by an almost 17 percent slump in shipments from China.The trade balance showed a surplus of 797.3 billion yen ($7.4 billion) versus the +499.2 billion yen forecast.
Gold has also slipped. Two geopolitical events may have had the affect of reducing demand for safe havens.
Easing tensions on the Korean Peninsula, signaled by the news that US President Donald Trump's nominee for Secretary of State, CIA Director Mike Pompeo made a secret visit to North Korea over the Easter weekend and met with North Korean leader Kim Jong Un helped calm market worries, as did early signs that the Trump-Abe summit won’t reveal any new trade demands from the US
Yesterday, US stocks extended their rally. The S&P 500 accomplishing multiple technical feats, including opening higher with a breakaway gap, which crossed above the neckline of a H&S bottom, cutting through the 50 dma and closing above the 100 dma.
However, some technicians consider trading since the January peak to have been developing a Descending Triangle top. A close above 2,750 should dispel that view.
This bullishness—despite an escalating trade war in which China slapped new agricultural duties on US sorghum imports after yesterday's US ban on sales of parts by US firms to China's ZTE Corp (OTC:ZTCOY)—was delivered courtesy of mega cap company earnings beats. Netflix (NASDAQ:NFLX) surged after subscriber growth topped estimates, helping to propel technology shares higher, and UnitedHealth (NYSE:UNH) climbed after reporting strong results.
Earnings are now front and center in the market narrative. Indeed, the threat of additional airstrikes against Syria, which could have had far reaching fallout including an escalating military confrontation with Russia, has completely disappeared from the narrative. Investors have even shrugged off Trump's currency manipulation accusations against both Russia and China, contrary to a report by the Treasury department. So much so that currently the US dollar remains bid.

Oil rebounded after US crude stockpiles declined by 1 million barrels in the week to April 13 to 428 million, even though analysts expected a bigger fall of 1.4 million barrels.
Up Ahead
- Morgan Stanley (NYSE:MS) reports Q1 2018 results before the market open, with an EPS consensus of $1.28, versus $1.00 for the same quarter last year.
- The Bank of Canada releases a monetary policy decision later today.
- Finance ministers and central bank chiefs from around the world gather for spring meetings at the IMF in Washington.
- OPEC's Joint Ministerial Monitoring Committee meets in Jeddah, Saudi Arabia on Friday. Their discussions could set the tone for oil production in 2019.
Market Moves
Stocks
- The Stoxx Europe 600 Index climbed 0.1 percent.
- Futures on the S&P 500 Index advanced 0.1 percent earlier, to the highest in four weeks.
- The MSCI All-Country World Equity Index gained 0.1 percent to the highest in four weeks.
- The U.K.’s FTSE 100 advanced 0.3 percent.
- Germany’s DAX increased 0.1 percent to the highest in more than 10 weeks.
- The MSCI Emerging Markets Index gained 0.3 percent, the biggest rise in more than a week.
- The MSCI Asia Pacific Index gained 0.6 percent to the highest in a week on the largest rise in more than a week.
Currencies
- The Dollar Index advanced 0.1 percent, paring a 0.2 percent jump.
- The euro dipped 0.1 percent to $1.2354.
- The British pound decreased less than 0.05 percent to $1.4284.
- The Japanese yen fell 0.3 percent to 107.37 per dollar, the weakest in almost two weeks.
Bonds
- The yield on 10-year Treasuries gained one basis point to 2.84 percent, the highest in more than three weeks.
- Germany’s 10-year yield increased less than one basis point to 0.51 percent.
- Britain’s 10-year yield climbed less than one basis point to 1.436 percent.
Commodities
- West Texas Intermediate crude advanced 0.9 percent to $67.10 a barrel, the largest gain in a week.
- Copper gained 0.9 percent to $3.13 a pound, the highest in a week on the biggest rise in more than a week.
- Gold decreased 0.3 percent to $1,343.76 an ounce.


