-
Apple’s rumored next-gen display leads to tech selloff in Japan, South Korea
-
US regulatory investigation into South Korean airbags hits car makers
-
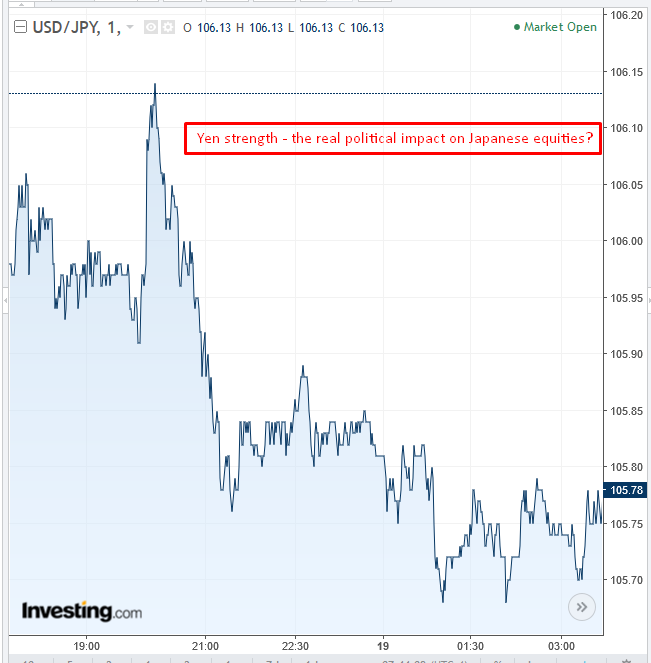
Japanese PM Abe's political troubles boost yen, weigh on domestic shares
-
European stocks open lower on miners' losses
-
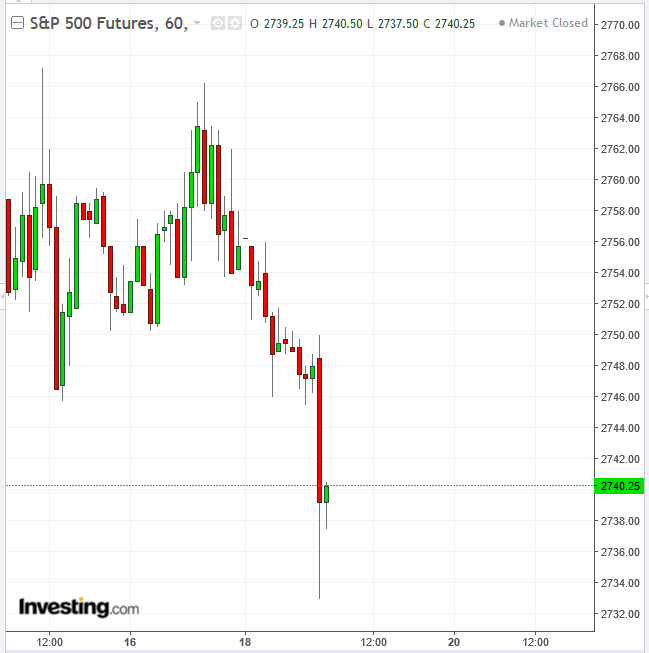
S&P 500 Futures point lower
-
US Treasury official’s faux pas underscores worsening trade relations
-
PBoC changes guard for the first time in 15 years
-
Views differ on number of interest rate hikes in 2018
-
Oil price caught between opposing forces, but poised to rally
Key Events
Last week, US stocks seesawed between mixed economic data and various political headwinds. This morning, stocks in Asia were mixed, though generally on a downward trajectory. While the entire region was focusing on the Fed's upcoming two-day monetary policy meeting, with some investors bracing for the possibility of four hikes this year, individual markets performed in-line with local developments, with varying results.
Japanese stocks underperformed, followed by South Korean shares. Technology shares sold off in both markets after a report broke that Apple (NASDAQ:AAPL) is secretly working on developing its own, next-generation, MicroLED screens. The US tech giant neither confirmed nor denied the report, which could badly hurt Asian display suppliers to the world's largest information technology company.
The prospect that these suppliers would be cut out of a reliable, steady sales channel by Apple, along with the the loss of prestige that would follow, prompted traders to dump shares listed on the TOPIX, Nikkei 225 and KOSPI. The South Korea benchmark was also dragged lower by auto manufacturers Hyundai Motor (KS:005380) and KIA Motors (KS:000270), after a US regulator said it was investigating their airbag safety system.
Last June we argued that Apple needs to come up with a launch or upgrade as strong as its inaugural iPhone, to keep its lead in the tech industry. Should news reports prove accurate, and the iPhone maker unveil a cutting-edge display, its Japanese and South Korean suppliers would naturally take a hit.
Global Financial Affairs
Japanese traders were also wary of political risk, as the country's Prime Minister Shinzo Abe is facing dwindling support. However, we have repeatedly pointed out that since the June 2016 Brexit vote, political risk doesn’t seem to play a significant role in investor decision making.
An exception would be the plunge seen in Spain’s IBEX 35 index as the noise around Catalan's independence referendum started to pick up last June. But even in that case, the Spanish benchmark bottomed after the referendum actually took place on October 1.
So a different, much more consistent explanation for the equity slump seen in the Japanese market is the fact that the stronger yen has weighed on share prices. A stronger currency has in fact made investment in local stocks more expensive for foreign buyers.

But why would the yen edge higher just as domestic political risk is mounting? Because of its safe-haven status. The same dynamic happened with the US dollar in 2008, when the subprime mortgage crisis developed into a stock market crash. Back then, the USD became the safest currency in the world, as global investors, bracing for a worldwide market collapse, put their faith in the greenback. We might be witnessing the same phenomenon with the yen, which is the market's favorite safe-haven asset at present.
In early European trade, mining shares and commodities weighted on local indices as they were pressured by the stronger dollar. The STOXX Europe 600 is set for its first decline in three sessions.

S&P 500 futures are down, which suggests that the underlying index is bound to open in the red. Investors seem to be nervously monitoring two key headwinds: the ongoing possibility of a trade war and the Fed's upcoming interest rate decision.
David R. Malpass, US Treasury Under-Secretary for International Affairs, announced yesterday that the US was pulling out of economic negotiations with Beijing, after ten years of collaboration. However, a few hours later the government official about-faced and said he had misspoken. Investors are unlikely to buy into Malpass's U-turn. His faux-pas is likely to add to recent market choppiness, as investors try to determine direction amid widespread political uncertainty.
In China, the market is digesting the appointment of Yi Gang as the new Governor of the People's Bank of China, which marks the first change at the PBoC's helm in 15 years. So far, Yi Gang has signaled he will continue down the path of financial liberalization, in line with outgoing governor Zhou Xiaochuan.
On Wednesday, the Federal Open Market Committee (FOMC), will meet for the first time since Jerome Powell was appointed Fed Chair. The monetary policy meeting comes just a few weeks after Powell signaled that he’s considering a fourth rate hike this year, in addition to the three hikes currently priced in to dot-plot forecasts.
Analysts from Goldman Sachs and other Wall Street banks expect the median projection will rise to four hikes on Wednesday, as the FOMC's two-day meeting begins. Other analysts believe that the recent round of mediocre economic data will reinforce policy makers’ stated intentions to move gradually, and therefore stick with three hikes this year.
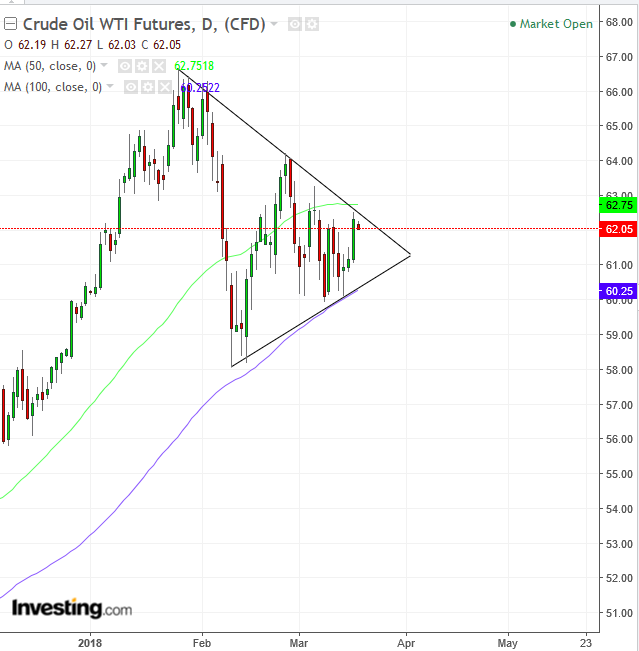
Oil remains steady above $62, caught between two opposing forces. On the bullish side, last week's firing of Secretary of State Rex Tillerson cleared the way for the US to drop out of its nuclear agreement with Iran as early as May 12, which marks the next deadline for extending a waiver on sanctions against the Middle Eastern oil producer. That would potentially eliminate the 4.2 million barrels of oil per day that Iran produces, putting a deep dent into global supply.
On the bearish side, current price levels are gradually giving back confidence to oil producers, according to Woodside Petroleum's CEO Peter Coleman.

In the oil chart, above, you can see the two opposing forces in play, via the symmetrical triangle on the chart, as well as the range between the 50 dma (green) and 100 dma (blue). This is presumed to be a continuation pattern, confirmed with an upside breakout.

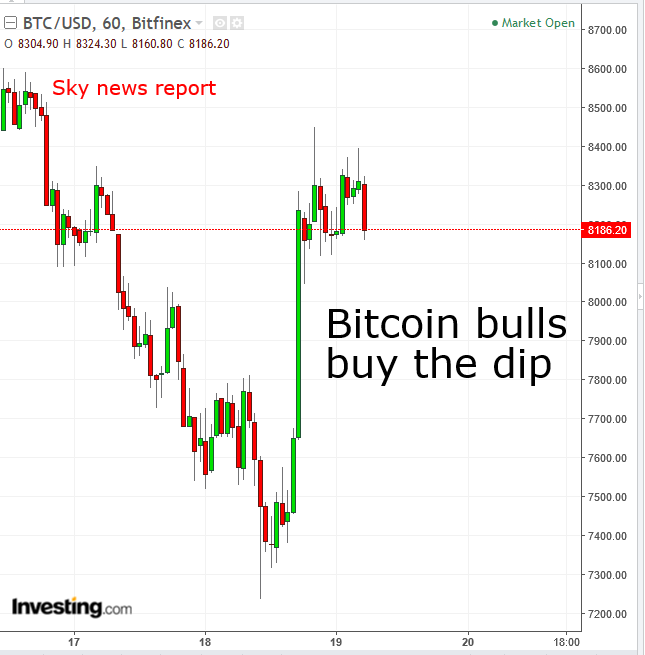
Bitcoin has been swinging within a 15 percent range since reports that Twitter will join Google and Facebook in banning crypto-related ads. Despite the blow, the most popular cryptocurrency came back from yesterday’s $7,240 abyss, as Bitcoin bulls bought the dip, which pushed the currency back over $8,300. This set the digital currency on course for its highest close since Tuesday.
Up Ahead
-
The Fed interest rate decision and Powell’s news conference are scheduled for Wednesday.
-
The Bank of England is expected to hold interest rates and leave its asset-purchase program unchanged on Thursday. Attention will focus on language and the odds for a hike in May.
-
Oracle (NYSE:ORCL) is scheduled to release earnings after market close, with a $0.66 EPS forecast, vs $0.63 for the same quarter last year.
Market Moves
Stocks
-
The STOXX Europe 600 Index fell 0.2 percent.
-
Futures on the S&P 500 Index dropped 0.2 percent to the lowest level in more than a week.
-
The MSCI Asia Pacific Index dipped 0.6 percent to the lowest level in more than a week.
-
The UK’s FTSE 100 declined 0.5 percent to the lowest in two weeks.
-
The MSCI Emerging Market Index slipped 0.4 percent to the lowest level in more than a week.
Currencies
-
The Dollar Index is flat, after gaining earlier 0.13 percent.
-
The euro sank 0.2 percent to $1.2268, the weakest level in more than two weeks.
-
The British pound fell less than 0.05 percent to $1.3938.
-
The Japanese yen climbed 0.1 percent to 105.93 per dollar, the strongest in more than two weeks.
-
South Africa’s rand sank 0.6 percent to 12.0421 per dollar, the weakest in more than five weeks.
-
The MSCI Emerging Markets Currency Index declined 0.2 percent to the lowest in two weeks.
Bonds
-
The yield on 10-year Treasurys advanced two basis points to 2.87 percent, the highest level in more than a week.
-
Germany’s 10-year advanced one basis point to 0.58 percent, the first advance in more than a week.
-
Britain’s 10-year yield increased two basis points to 1.429 percent, the biggest increase in almost two weeks.
Commodities
-
WTI crude decreased 0.5 percent to $62.03 a barrel.
-
Gold fell 0.4 percent to $1,308.92 an ounce, the weakest in 11 weeks.
