-
S&P 500 selloff extends, but it may be part of a bullish pattern
-
Energy stocks lead declines, after crude stockpiles unexpectedly rise
-
Volatility returns to markets, pressuring institutional investor strategies
-
Dollar may be bottoming
-
Aussie enters a downtrend as business investment disappoints
-
Bitcoin continues to struggle between opposing trends
Key Events
US equities extended a selloff to a second day, ending their worst month in two years, even as yields on the 10-year bond—the purported catalyst of the near 12-percent stock decline between January 29 and February 9—dropped three basis points to 2.87.
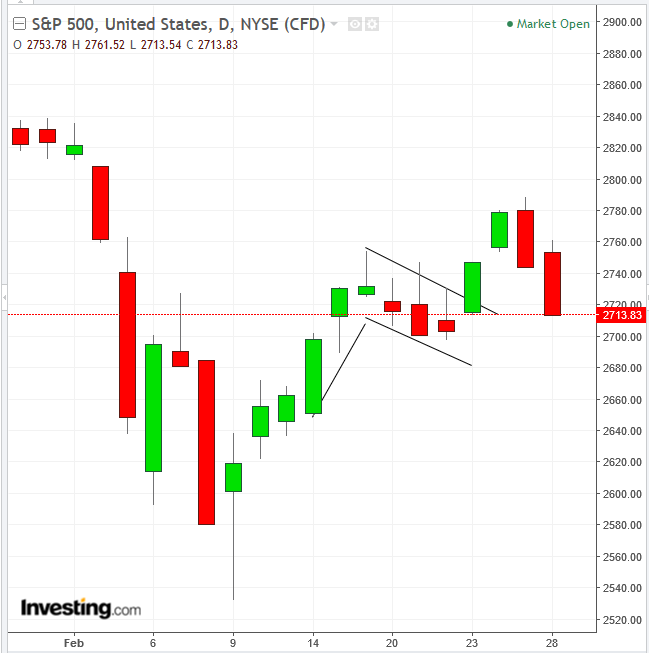
The S&P 500 dropped 1.11 percent, with all sectors in the red. Energy led the dip, falling 2.31 percent, while Real Estate—which was yesterday's laggard after losing 2.14 percent—fought its way through, dropping only 0.13 percent. The total decline for real estate shares for both days was 2.36 percent. The SPX monthly slide totaled 3.9 percent, trimming back the intra-month low of 10.3 percent that was registered on February 9.
Technically, the two-day drop is considered a return-move, part of a pattern after a breakout. The preceding two-day rally provided an upside breakout to a continuation flag pattern. Now, a presumed increase in demand, following the sharp rally preceding the consolidation, is expected to pick up the supply and rebound prices higher.
The Dow Jones Industrial Average plunged 1.51 percent, or 2.65 percent over the two day period. The monthly decline totaled 4.24 percent, significantly trimmed from the 10.62 percent low of February 9.
The NASDAQ Composite slipped the least, 0.76 percent, to a total two-day loss of 1.99 percent. The monthly loss of 1.24 percent, which pruned an earlier 10.55 percent plunge, means the information-technology index is once again the outperforming index on every parameter.
The Russell 2000 plunged 1.63 percent for the day, for a total 2.99 percent two-day drop, thus once again underperforming its peers. The monthly decline was 3.9 percent—mirroring losses on the S&P 500 Index—cutting back the 8.85 percent plunge of February 9.
The main takeaway for stock investors is the return of volatility, both in the equity and Treasury market.
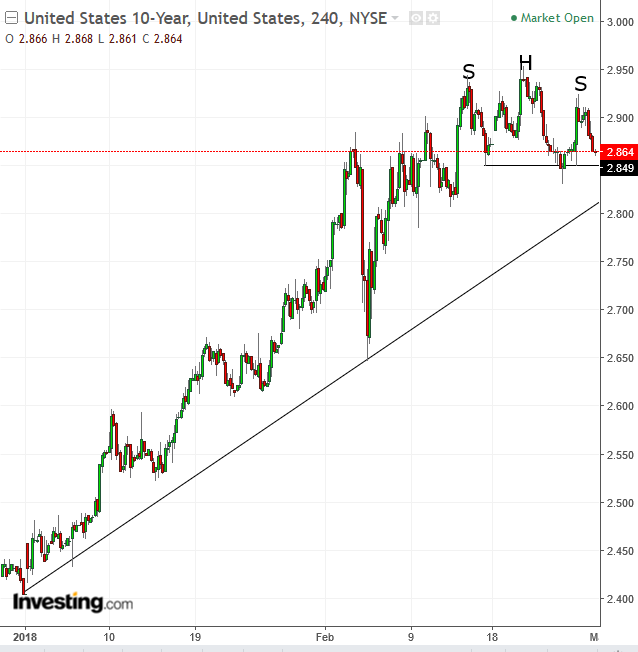
The 10-year Treasury yield held just below 2.9 percent. This is roughly where it began at the beginning of February, a month that saw it fall to as low as 2.70 percent, but also rise as it came within just five basis points of the 3 percent mark—a level it hasn’t touched in four years.
On Tuesday, we forecast that yields would drop after both the MACD and RSI provided sell signals. On Wednesday, they dropped 3 basis points, forming a potential H&S top on the four-hour chart, with an implied 2.75 percent target, upon a downside breakout. Such a decline would halt an uptrend line since the beginning of the year, opening the door to a reversal, which almost always includes a tug-of-war between bears and bulls. In other words, more volatility.
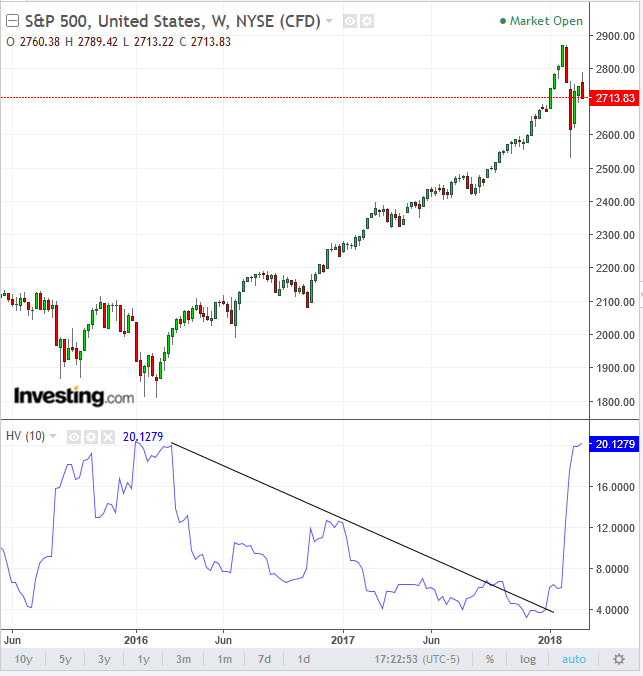
February volatility provided an upside breakout to its downtrend since March 2016. The breakout was so severe that it climbed back to those March 2016 levels.
The repercussions are twofold:
- The major players—hedge funds and investment banks—must exit complex positions designed for a stable market, and reshape their strategies based on an environment beset by volatility; and
- Classic bond investors have migrated into equities during a stable market as they sought positive yields in a low-yield environment, benefiting from stock dividends in lieu of bond yields. However, when prices swing between extreme profits and deep losses, the typical bond investor will presumably not be comfortable with the volatility that rocks the equities market.
Global Financial Affairs
This morning, most markets in Asia continued the global selloff, with the exception of Chinese indices. Japan's Nikkei 225 closed at its lowest level since mid-February, sliding 1.56 percent, or 343.77 points, dragged down by automakers, technology and financials stocks.
Chinese shares recouped earlier losses to end higher on Wednesday, after the Caixin Manufacturing PMI, a private survey with a focus on small and mid-sized companies, increased to 51.6 in January, beating expectations of 51.3 and surging to a six-month high.
Stocks in Europe also tuned into the global risk-off mood, as shares tumbled lower. Retailers and media companies led the losses in the STOXX Europe 600 Index, continuing yesterday's US selling of media stocks, after Comcast (NASDAQ:CMCSA) started a bidding war with Disney (NYSE:DIS) and Twenty-First Century Fox (NASDAQ:FOX) over Sky (LON:SKYB).
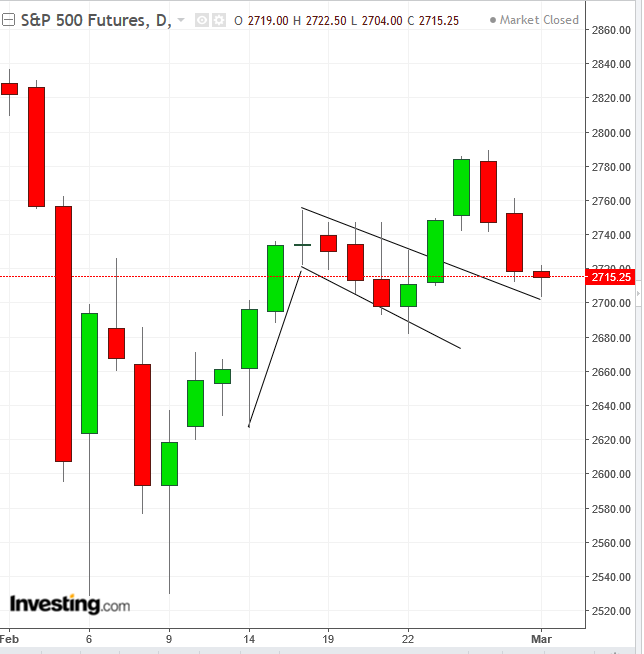
Still, there is a bright light at the end of today’s selloff tunnel. The S&P 500 Futures Index pared a sharper decline, on support of a continuation pattern, increasing the likelihood for a rebound when the US session opens, after the worst monthly performance in two years.
Investors will be closely watching Jerome Powell’s second testimony as new Fed Chair later today, after he shared an optimistic outlook for the US economy on Tuesday.
Investors have reverted to an earlier fear that interest rate hikes will increase borrowing costs, both for firms, whose growth would be hampered, and for themselves, as they wouldn't be able to sustain higher equity prices. Such is the view of Ray Dalio, President of Bridgewater Associates, the largest hedge fund in the world. However, before the November 2016 election, Dalio also said that if Trump wins, the Dow will see its biggest crash in history.
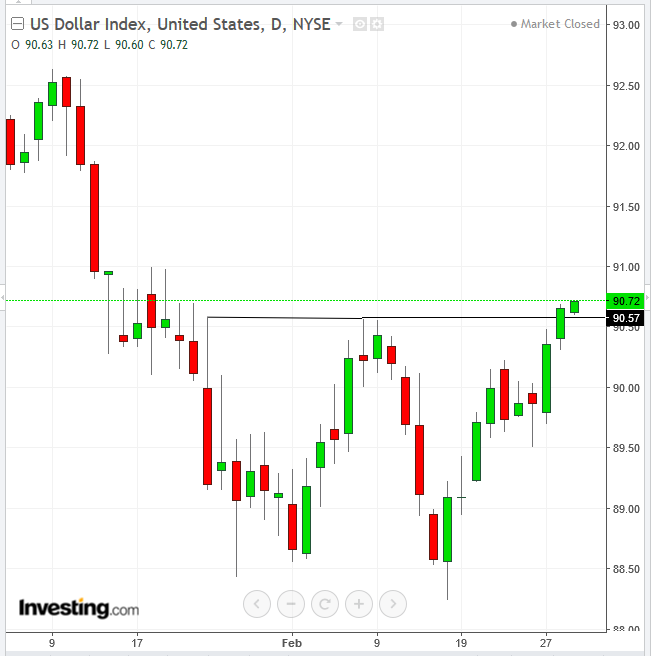
The dollar built on its monthly gain, climbing against major peers, including the euro and pound. Technically, the surge is flirting with an upside breakout of a double bottom. However, the 0.1 percent penetration begs for a bull-trap. Traders use filters of time and/or price depth to avoid such traps.
Spot gold headed for the lowest close in almost two months on the expectation of higher interest rates.
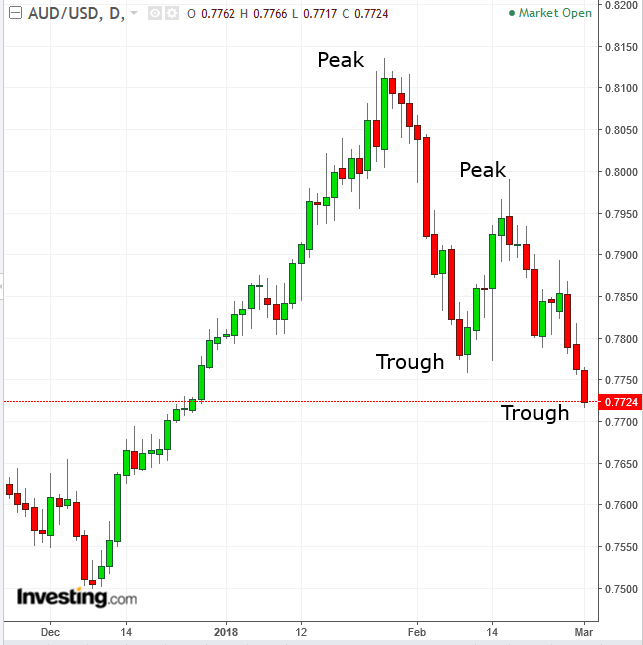
The Aussie fell after fourth quarter business investment missed estimates. Technically, a second trough has been registered, completing the minimum two peak and trough sequence for a new trend, lower.
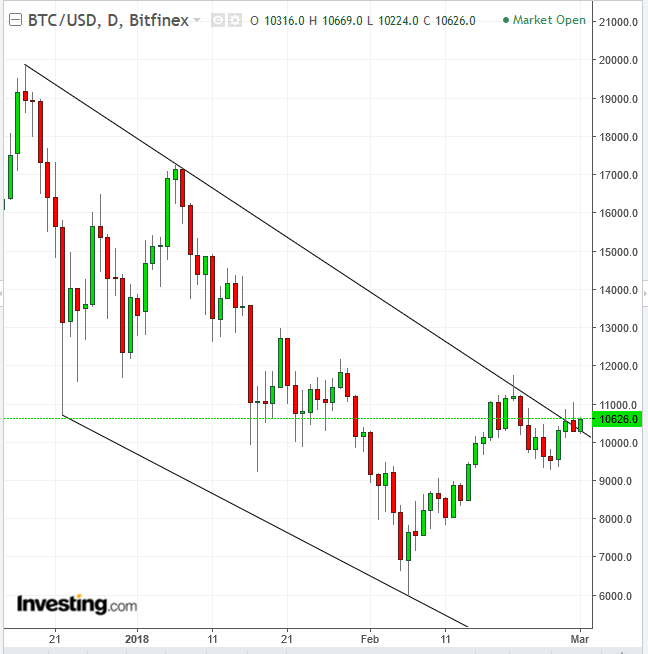
Bitcoin formed a Shooting Star yesterday, closing below the falling channel-top. Today, it's retesting that resistance.
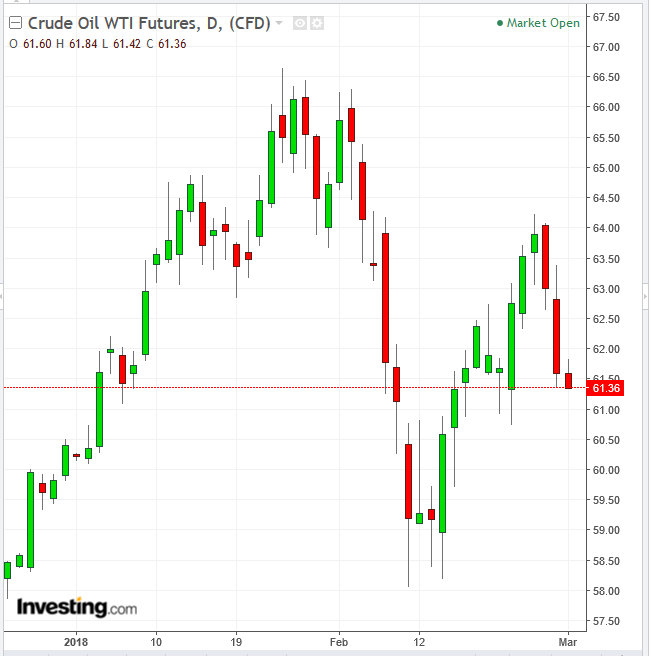
The price of WTI crude continues to fall for a third day, following yesterday's two week low as inventories increased much more than expected. Crude output by the Organization of Petroleum Exporting Countries rose by 130,000 barrels a day in February, amid higher production from Libya, Nigeria and Venezuela, according to JBC Energy.
Meanwhile, U.S. shale explorers have been pumping more than 10 million barrels a day since November, hitting an all-time high and beating the 1970 record, revised data showed yesterday. US production is currently equal to that of Saudi Arabia and is on course to surpass Russia as the world’s largest source of oil.
Up Ahead
-
Fed’s Powell testifies before the Senate Banking Committee on Thursday. Other Fed speakers this week: William Dudley.
-
UK Prime Minister Theresa May delivers a speech Friday on Britain’s relationship with the European Union.
Market Moves
Stocks
-
The STOXX Europe 600 Index declined 0.3 percent as of 8:05 a.m. London time (3:05 EST).
-
The MSCI All-Country World Index fell 0.2 percent to the lowest level in more than two weeks.
-
Futures on the S&P 500 Index gained 0.2 percent.
-
The UK’s FTSE 100 declined 0.7 percent to the lowest level in more than two weeks on the largest drop in almost three weeks.
Currencies
-
The dollar Index increased less than 0.1 percent to the highest level in more than 5 weeks.
-
The euro gained less than 0.05 percent to $1.2197.
-
The Japanese yen dipped 0.2 percent to 106.86 per dollar.
-
South Africa’s rand sank 0.4 percent to 11.8485 per dollar, the weakest level in more than two weeks.
-
The British pound fell 0.1 percent to $1.3748, the weakest level in almost seven weeks.
Bonds
-
The yield on 10-year Treasuries gained less than one basis point to 2.86 percent.
-
Germany’s 10-year yield fell less than one basis point to 0.65 percent, the lowest in almost five weeks.
-
Britain’s 10-year yield declined six basis points to 1.501 percent, the lowest in a month on the largest fall in almost two weeks.
Commodities
-
WTI crude advanced 0.2 percent to $61.75 a barrel.
-
Gold decreased 0.5 percent to $1,312.29 an ounce, the weakest in two months.
-
LME copper declined 0.1 percent to $6,927.00 per metric ton, the lowest in more than two weeks.
