-
US equities complete bullish patterns
-
Spike in Financials, yields suggests investor optimism on interest rates
-
South Korean won heads for a third-day rally as BoK holds rates at 1.5 percent
-
Oil slips ahead of inventories data
-
Bitcoin attempts a reversal, pushing against its downtrend line
Key Events
US equities advanced to nearly a four-week high yesterday.
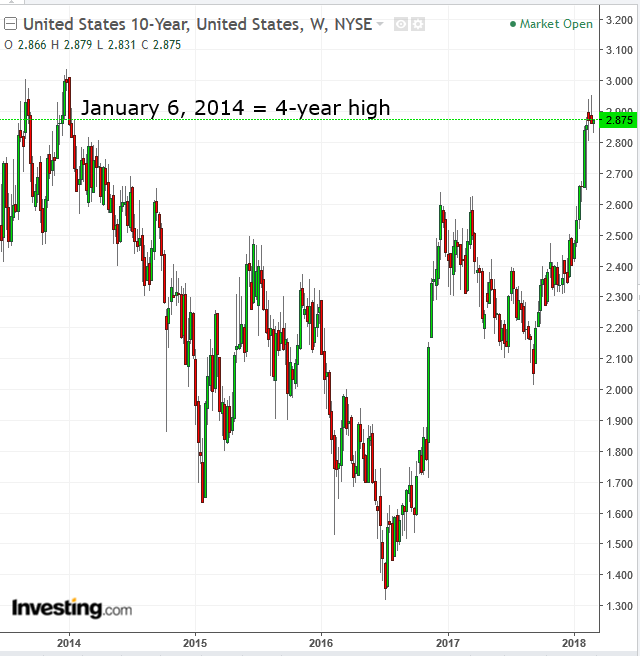
Equity gains coincided with an extensive drop in Treasury yields, in line with what we’ve been suggesting—as recently as yesterday—that falling yields may mean investors are rotating back from Treasurys into equities. The dollar has reverted from its negative correlation to equities, rebounding from an early loss and extending its advance to a second day.
The falling yields, when Treasury supply exceeds demand, demonstrate that investors have reduced their interest rate outlook from where it was at the beginning of the month, when that expectation caused yields to spike and equities to sell off. The dollar rise, however, contradicts that view. Lower interest rates would yield smaller returns to dollar holders, who should therefore reduce demand, weakening the buck.
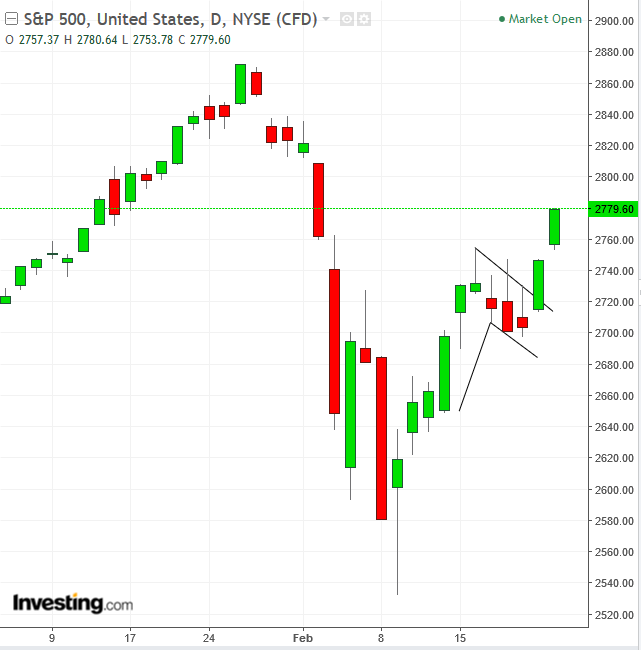
The S&P 500 opened higher, extending gains for a third day, having added 1.20 percent, for a total of 2.9 percent.
The three outperforming sectors were all growth stocks: Technology (+1.57 percent), Financials (+1.51 percent) and Industrials (+1.38 percent). The sole sector in the red was a classic defensive sector, Utilities (-0.3 percent).
It should be noted that the fact that the rally was also led by Financials seems to contradict the purported sudden, lower expectations for interest rate hikes, which are widely considered to impair bank profits. As such, a rise in financials seems to indicate investors did in fact retain their initial outlook for a faster pace of rate hikes.
How to reconcile that with a rebound in equities, which have recently suffered the worst selloff in two years because of heightened expectations that the Fed's accommodative stance was finally ending? We might ask the same question about yields which are still at a four-year high. Wasn't a surge in yields the main cause for the sharp selloff? Why, then, have investors backtracked into stocks?
Perhaps because they re-adjusted their view—from predicting that higher borrowing costs would make it more prohibitive for companies to grow and for investors to keep buying stocks, to focusing on the fact that an expanding economy would provide a fertile environment for companies to thrive without accruing additional debt. This second option would also translate into lower margin debt for investors.
The advance brings the S&P 500 just 1.6 percent from reaching a four-week high and 3.3 percent from repeating its double record (high and close) of January 26.
Technically, the rally completed a bullish Falling Flag, discussed yesterday, implying a target of 2,825, just 1.6 percent beneath the benchmark’s double record.
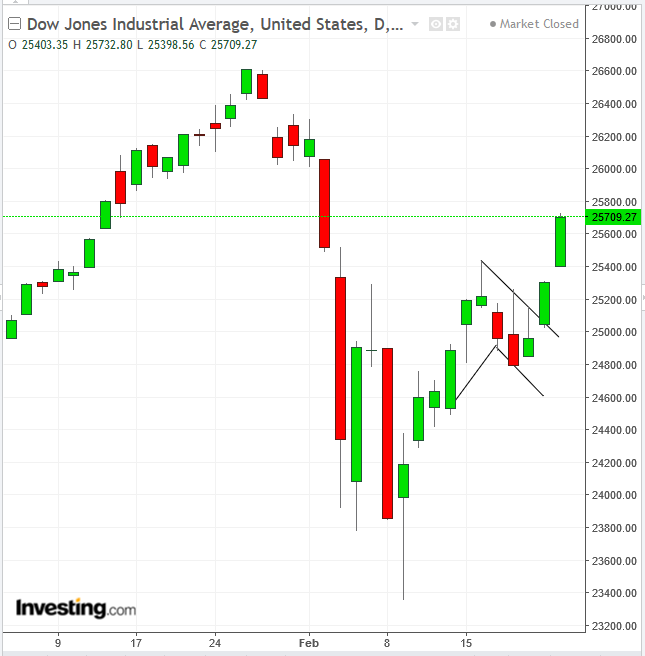
The Dow Jones Industrial Average jumped 1.6 percent, also extending its rally to a third day for a total 3.7 percent leap. Yesterday's advance brings the Dow within 1.7 percent of a four-week high and 3.4 percent from its double record.
Technically, the advance confirmed the breakout of a bullish Falling Flag, with an implied target of 25,980, 2.4 percent from the index’s double record.
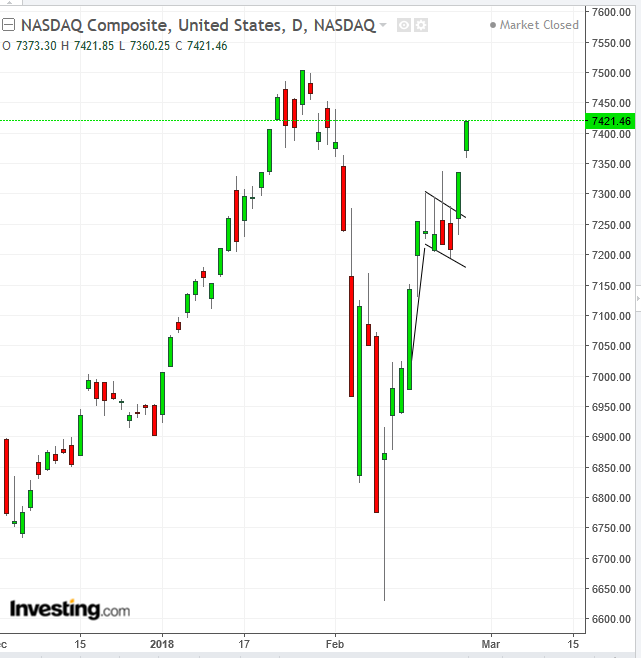
The NASDAQ Composite climbed 1.15 percent for a second day, to a total advance of 2.94 percent.
This brings the information-technology benchmark to an actual four-week high, just 1.10 percent away from its double record. Although yesterday’s rally underperformed both the S&P and Dow, and its two-day rally underperformed the three-day rally of the two main indices, the NASDAQ outperformed both peers during the selloff from the January 26 double-record high to the February 9 bottom, as well as in the following rebound rally.
Selloff and Rebound Comparison
The S&P 500 declined 11.82 percent from its record high to the February 9 low, while the Dow underperformed its peers, plunging 12.17 percent from the high to the low. The NASDAQ Composite outperformed, losing the least on the way down (11.6 percent), displaying the strongest performance on the way up, gaining 11.93 percent. Therefore, despite the underperformance of the past three trading days, its current four-week high means it is racing ahead of its peers.
Technically, the NASDAQ also completed a bullish Falling Flag, whose implied target is 7,600, a whole percent above its double record. The outperforming target is due to the bigger price jump in forming the flag pole, the sharp move that precedes the flag pattern, when earlier investors take profits, selling to newcomers hoping to enjoy the same profits, ultimately leading the advance themselves.
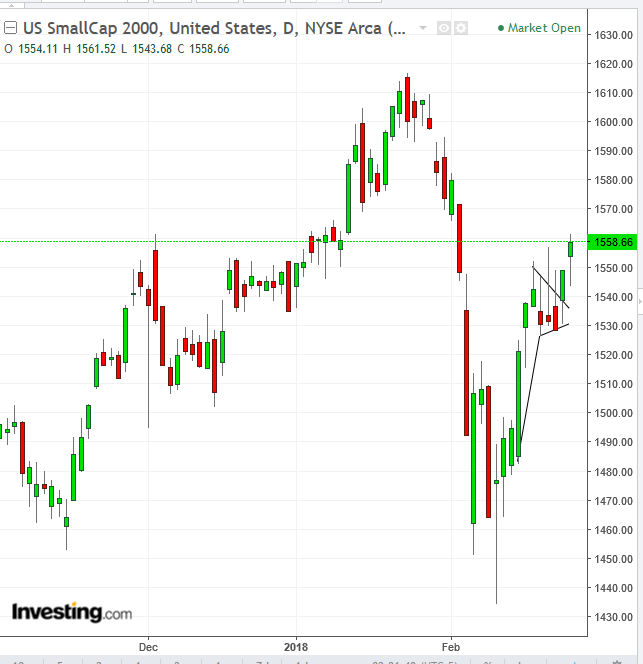
The Russell 2000 climbed 0.65 percent, extending its rebound to a second day, like the NASDAQ Composite. But unlike the tech-heavy index, the small-cap index's two-day aggregate rebound pushed it only 1.97 percent higher, which means it underperformed the NASDAQ by almost one percentage point. The small-cap benchmark remains 3.7 percent away from its all-time high of January 24—the deepest gap among its peers.
Technically, the rise confirmed the completion of a pennant, a continuation pattern, with the same psychology as the flag: bullish in an uptrend. The sharp move preceding the pennant implies a target that would retest its record high.
We have been consistently reporting that the Russell tends to underperform its large-cap peers. This can be a good sign for the market because a market-top psychology is stimulated by the highest level of greed, which can lead to irresponsible speculation. Since it's easier to make fast money with small caps, whose price moves garner bigger percentages versus large caps and thus into bigger profits, the last leg of a bull market is typically led by small caps. However, in this market dynamic small-caps have been underperforming, suggesting that greed for fast money and speculation has not occurred.
This complements our analysis above, suggesting investors have shifted their outlook on company profits and rising equity prices even with, or rather because of, higher rates.
Meanwhile, the biggest market players disagree over the implications of this month’s surge in yields. Morgan Stanley analysts think that "the bell has tolled for the best of the bear market in longer duration bonds,” backing a bullish call on Treasurys. In the opposite camp, Goldman Sachs analysts and Warren Buffet warned that Treasurys are risky, with the former predicting that yields on bonds with a 1-year maturity will come in between 3.25 percent and 4.5 percent by year end.
Global Financial Affairs
This morning, global stock prices indicate that investor sentiment is touch-and-go, with the left foot on the break and right foot on the accelerator.
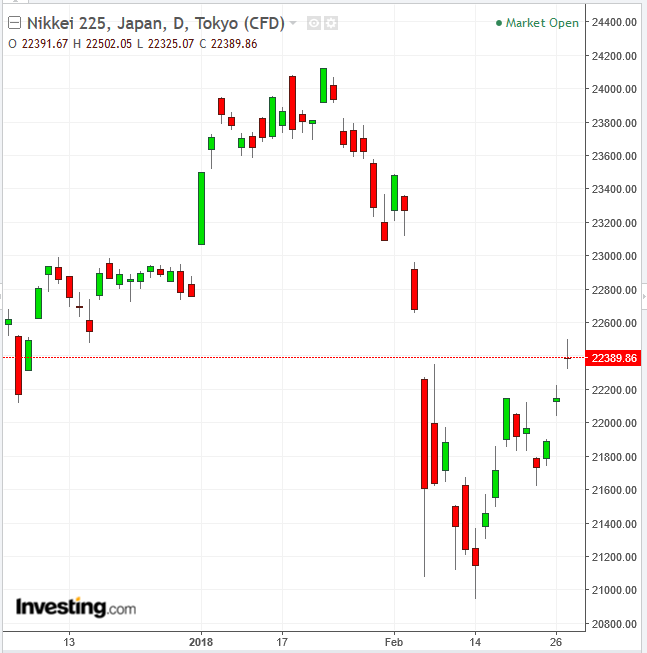
While Asian markets crawled higher, led by Japanese stocks listed on the Nikkei 225 advancing past a three-week high, traders were indecisive, as the High Wave candle in today’s trading pattern highlights. This bearish candle in a rally was formed under the top of the February-6 falling gap, a presumed resistance.
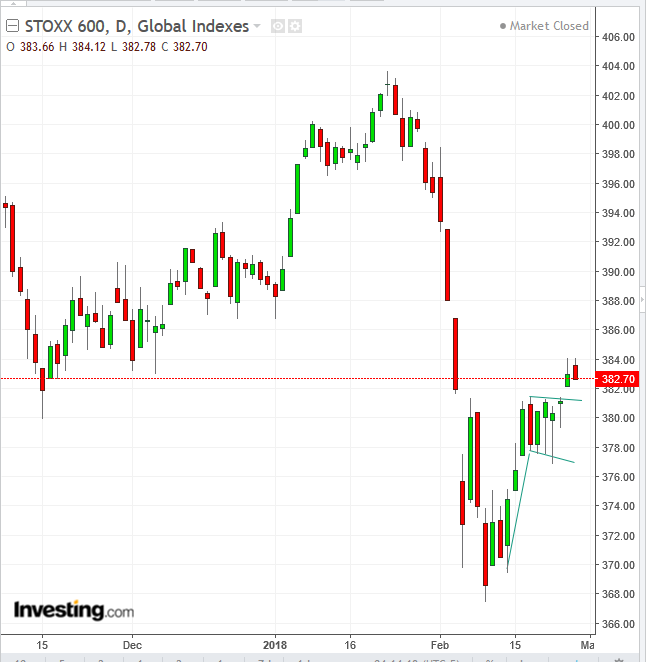
After climbing higher, led by media and technology companies, the STOXX 600 Index retreated. Technically, the price hit the resistance of Monday’s Shooting Star. Also, though it appears to be the breakout of a bullish Falling Flag taking shape, this is suspect due to the pattern’s location on the market map. A flag, by definition, is a continuation pattern. The psychology that drives another leg in the direction of the breakout is the preceding trend, which has been catching more and more attention. This pattern, however, did not develop into a trend, but upon the reversal itself. That means that more and more traders didn’t sweep after it as the trend developed.
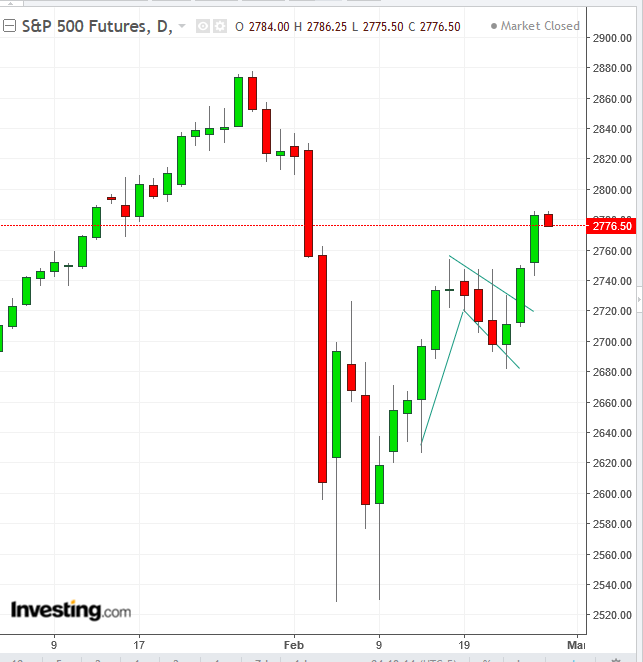
S&P 500 Futures are falling, suggesting the underlying index could follow suit. However, note that the flag pole, the move preceding the flag above 2,620, follows a prior up leg from 2,530, the February 9 low, fitting the flag psychology, as described above. Therefore, a decline in the S&P 500 should be considered nothing more than a return move, to retest the integrity of the pattern, before the next leg up.
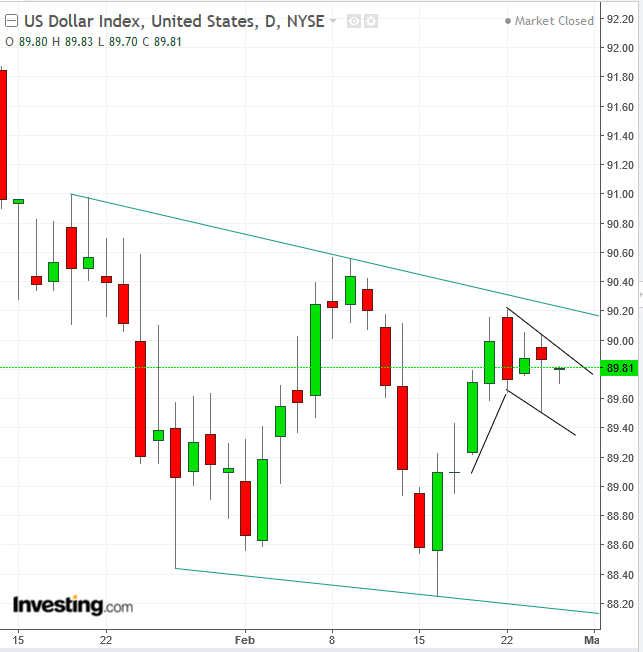
Investors are on hold as they await new Fed Chair Jerome Powell's testimony, after the shifting outlook on rate hikes riled markets. Technically, the dollar resumes a potential bullish Falling Flag, within a falling consolidation. An upside breakout of the flag may suggest an upside breakout of the larger pattern, which may prove to be a bottom.
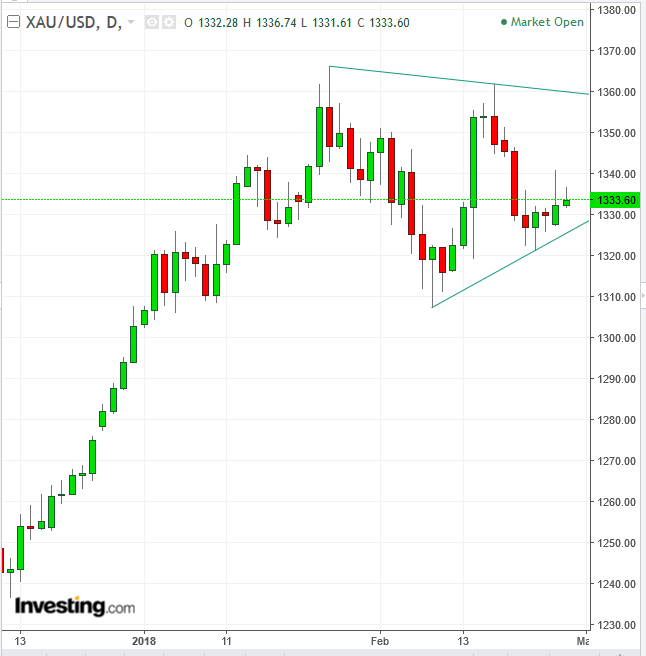
Yesterday, we elaborated the fundamental reasons why gold maintains a negative correlation with the dollar. Therefore, a second-day drop in the greenback led to a two-day rally for gold, which is at the bottom of a symmetrical pattern.
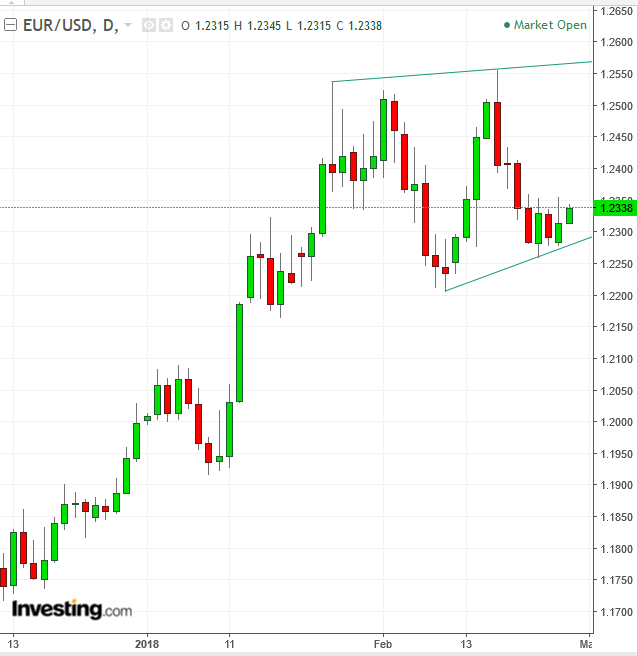
Like gold, the dollar's main trading partner, the euro, is at the bottom of a rising pattern. Yesterday, we expanded on why the single currency is expected to surge this year. The pattern implies an advance to retest the 1.2550, February 16 high.
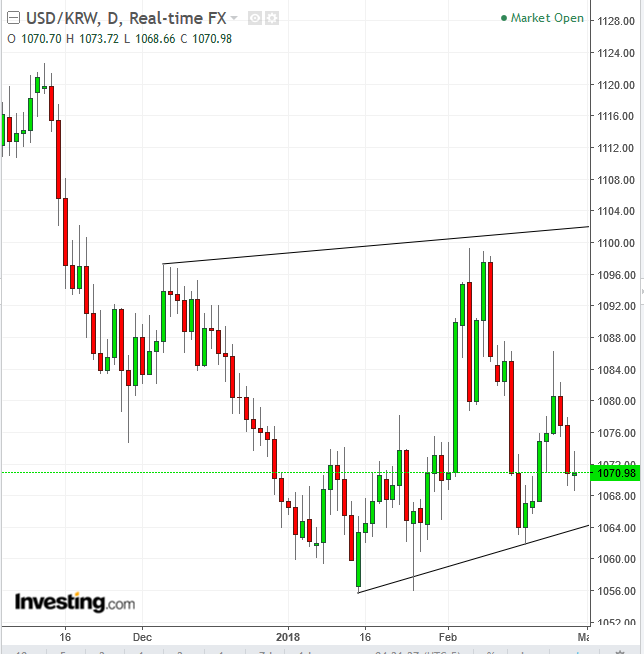
The won is heading for a third straight day advance, after the Bank of Korea left its benchmark interest rate unchanged.
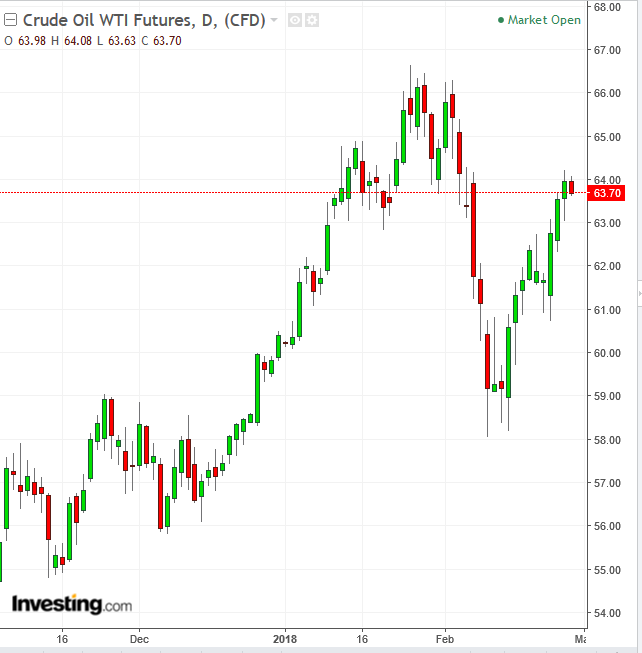
Oil slipped after a three-day rally as investors awaited U.S. inventory data. Technically, the price is meeting supply left over from the late-January-early-February consolidation.
Bitcoin is rising, up 3.7 percent today, for a straight second day, to a total of 12.10 percent. Bulls are pushing against the falling channel top. While there is a consistent support-resistance reversal level at $12,000, an upside breakout may suggest a reversal is in the works.
Up Ahead
-
Powell testifies before a House panel on Tuesday. He’ll discuss the Fed’s Semi-Annual Monetary Policy Report and the state of the economy. Powell returns on March 1 before a Senate committee.
-
The European Union will publish a draft Brexit treaty on Wednesday and UK Prime Minister Theresa May delivers a speech Friday on Britain’s relationship with the European Union.
-
A barrage of data is expected out of Japan including retail sales and industrial production on Wednesday, and capital spending on Thursday.
-
In China, the official manufacturing and non-manufacturing PMIs on Wednesday as well as the Caixin Manufacturing PMI on Thursday may show growth momentum slowed slightly in February, though results may have been altered by recent holidays.
Market Moves
Stocks
-
The STOXX Europe 600 Index gained 0.1 percent as of 9:16 a.m. London time (4:19 EST), the highest in more than three weeks.
-
The MSCI All-Country World Equity Index advanced 0.1 percent to the highest in more than three weeks.
-
Futures on the S&P 500 Index decreased 0.3 percent.
-
The UK FTSE 100 increased 0.4 percent to the highest in more than three weeks.
Currencies
-
The dollar Index fell 0.1 percent.
-
The euro climbed 0.1 percent to $1.233, the strongest level in a week.
-
The Japanese yen dipped 0.1 percent to 107.08 per dollar.
-
South Africa’s rand dipped 0.7 percent to 11.6337 per dollar, the biggest decrease in almost three weeks.
-
The British pound was unchanged at $1.3968.
Bonds
-
The yield on 10-year Treasuries advanced one basis point to 2.87 percent.
-
Germany’s 10-year yield gained three basis points to 0.68 percent, the first advance in a week and the biggest gain in more than a week.
-
Britain’s 10-year yield fell one basis point to 1.509 percent, reaching the lowest in four weeks on its sixth straight decline.
Commodities
-
WTI crude declined 0.4 percent to $63.67 a barrel, the largest drop in more than two weeks.
-
Gold declined less than 0.05 percent to $1,333.02 an ounce.
-
LME copper advanced 0.2 percent to $7,127.00 per metric ton.
