- Global indices, U.S. futures, dollar surge on Trump-Xi trade truce
- Gold, yen slide on shift to risk on
- WTI rallies as OPEC+ ready to sign off 9-month supply cuts extension
- The two-day meeting of OPEC+ oil producers kicks off in Vienna on Monday.
- U.S. markets remain closed on Thursday in observance of the Independence Day.
- The U.S. jobs report, due on Friday, is projected to show nonfarm payrolls rose by 160,000 in June, rebounding from 75,000 the previous month.
- The U.K.’s FTSE 100 gained 1.1%, the highest in almost 10 weeks on the largest rise in almost two weeks.
- The MSCI Emerging Market Index increased 0.5% to the highest in eight weeks.
- The MSCI Asia Pacific Index climbed 0.8% to the highest in almost two months.
- The Dollar Index climbed 0.3%8, the highest since May 20.
- The euro dropped 0.5% to $1.132, the weakest in more than a week on the largest dip in more than two weeks.
- The British pound slid 0.2% to $1.2669, the weakest in more than a week.
- The yield on 10-year Treasurys gained two basis points to 2.03%.
- Germany’s 10-year yield increased less than one basis point to -0.32%.
- Britain’s 10-year yield rose three basis points to 0.859%, the highest in more than a week.
- Gold sank 1.8% to $1,383.87 an ounce, the weakest in more than a week on the largest tumble in more than two years.
Key Events
Futures on the S&P 500, Dow and NASDAQ 100 gapped up by at least 1% this morning, tracking a jump in global stocks after U.S. President Donald Trump and Chinese leader Xi Jinping agreed on an interim trade ceasefire. The dollar strengthened, contributing to a slump in gold.The also yen weakened on investors' newly-found risk on sentiment.

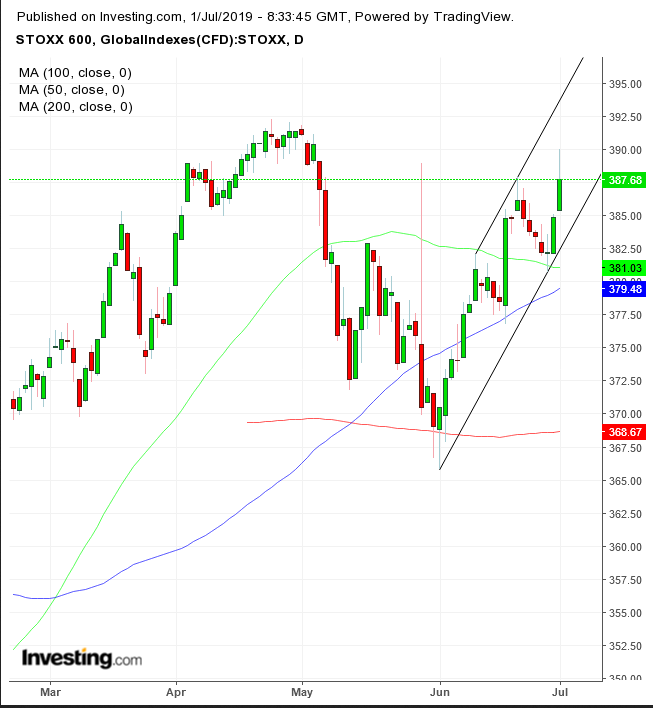
The STOXX 600 leaped, reaching its highest price since May and pushing every sector higher. Energy shares in particular outperformed, tracking a surge in crude prices on a preliminary agreement between Saudi Arabia, Iran and Russia to extend output cuts when they meet in Vienna on Monday and Tuesday. Technically, the pan-European benchmark extended an advance after finding support above the 50 DMA on Thursday, ending a three-day losing streak. Today’s jump posted a new peak within a rising channel since the June bottom.

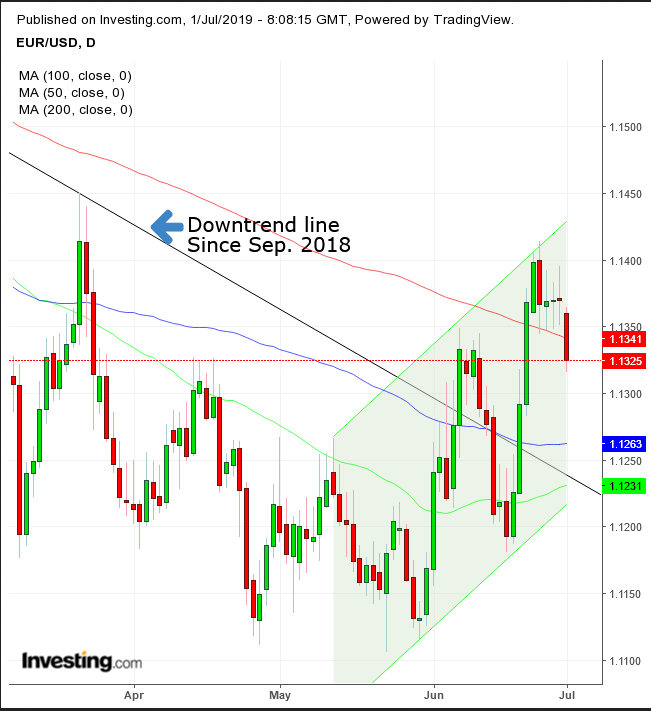
The European index also received a boost from the weaker euro, which is under pressure from key negotiations for the election of the next presidents of the European Central Bank and the European Commission. Technically, the common currency extended a correction after reaching the top of a rising channel last week. On the one hand, it fell below the closely-watched 200 DMA today; on the other, its short-term uptrend broke through the downtrend line since late September 2018.
In the earlier Asian session, China’s Shanghai Composite outperformed, surging 2.22% on the reprieve—even if temporary—on U.S. tariffs. Trump agreed on Saturday to scrap his plans for additional tariffs on $300bn of Chinese goods, as well as to ease restrictions on Chinese tech heavyweight Huawei. In exchange, China vowed to make new purchases of U.S. farm products and return to the negotiating table.
Japan’s Nikkei 225 (+2.15%) fared as the region's second best performer, closing +2.13% in the green. A falling yen gave the index a helping hand, while rising oil prices mitigated investor bullishness.

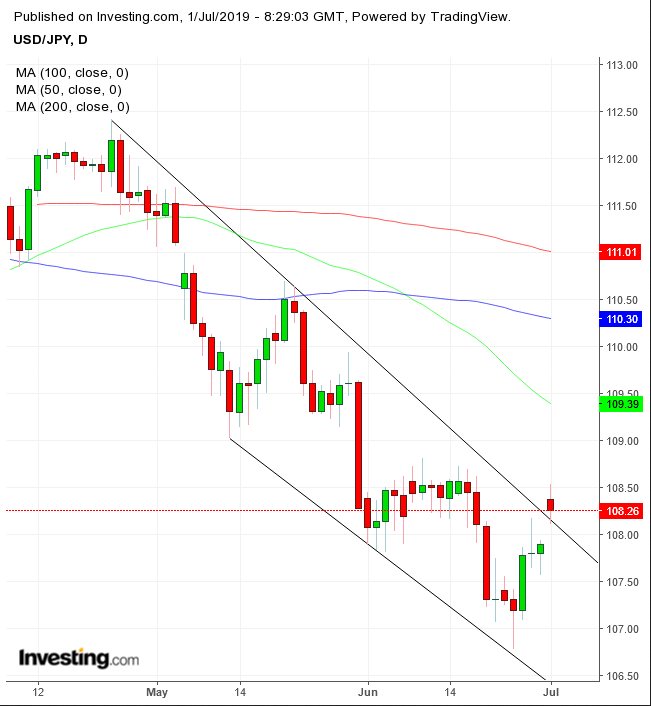
The yen weakened by about half a percentage point, making Japanese exports more competitive. Technically, the USD/JPY broke above a falling channel.
On the flipside, Japan relies on oil imports—which also justifies President Shinzo Abe's meeting with Iranian leaders last month, in an attempt to stabilize the region: cheaper oil prices ease energy costs for the state.
Hong Kong was closed for a holiday—ironically, the celebration of the anniversary of the former British colony’s repatriation to China, at a time of peaking tensions over the political ties between the two Asian countries.
Global Financial Affairs

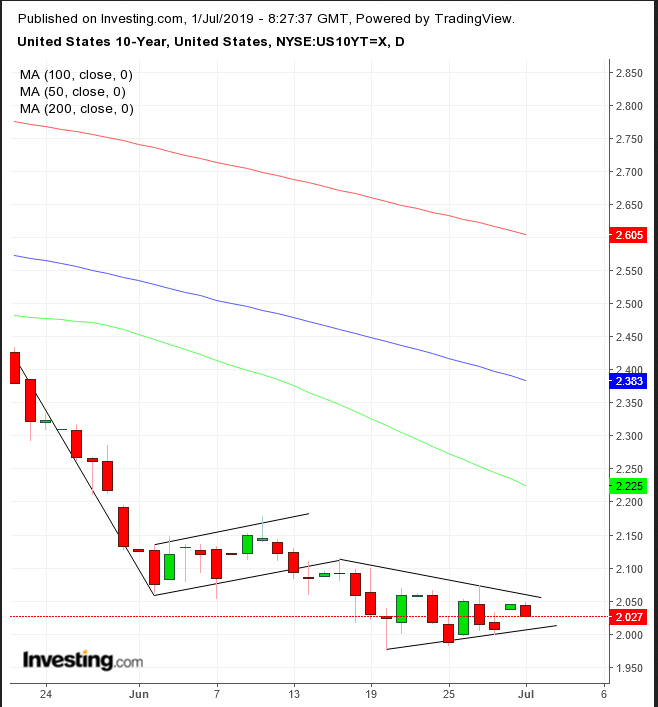
Yields on 10-year Treasurys rebounded after dropping despite the exuberant global equity rally. Technically, investors trading Treasurys caused yields to move within a pennant pattern, a continuation pattern. A downside breakout would signal a resumption of the prior downtrend. Right before the pennant development, yields completed a rising flag, also bearish in the downtrend, adding further impetus to the pennant’s completion.
WTI jumped as much as 3% on reports OPEC+ leaders stood ready to stretch supply cuts for another nine months after confirmation of the U.S.-China trade truce, which promises to spare the global economy from a slow down and therefore from weaker fuel demand.
Technically, the WTI price jumped above its downtrend line since April 23, increasing the probability of an upside reversal.
Up Ahead
Market Moves
Stocks
Currencies
Bonds
Commodities
