- ECB's Draghi boosts U.S. futures, European shares, with strong loosening signals
- Yields retest 2017 lows, yen climbs as investors also seek safety
- Euro slips, Australian dollar hits 10-year low on RBA dovishness
- FAANG lead U.S. gains ahead of Fed decision
- The Federal Reserve, the Bank of Japan and the Bank of England all set monetary policy this week, along with central banks in Norway, Brazil, Taiwan and Indonesia.
- Fed meetings begin on Tuesday, with a decision and press conference following on Wednesday. Officials are expected to debate a rate cut to shelter the U.S. economy from the downward effects of escalating global trade disputes.
- Tuesday will see a second ballot to select the successor of U.K. Prime Minister Theresa May.
- Also on Tuesday, final May CPI data comes out for the euro-area.
- U.K. retail sales are set for release on Thursday.
- Hong Kong’s Hang Seng gained 1% on the largest climb in more than a week.
- The MSCI Emerging Market Index climbed 0.4%, the first advance in a week.
-
- The Dollar Index dropped less than 0.05%, rebounding from a 0.2% decline
- The Japanese yen strengthened 0.3% to 108.24 per dollar.
- The Hong Kong dollar gained less than 0.05%.
- The MSCI Emerging Market Currency Index advanced less than 0.05%, still the first advance in a week.
- The yield on 10-year Treasurys slid two basis points to 2.07%.
- Britain’s 10-year yield fell one basis point to 0.842%.
- Germany’s 10-year yield dropped one basis point to -0.25%
Key Events
Futures on the S&P 500, Dow and NASDAQ 100 rebounded alongside European equities this morning, as the European Central Bank's President Mario Draghi offered markets the clearest sign yet that the ECB stands ready to unleash further easing if inflation remains subdued—boosting hopes policymakers on the other side of the Atlantic will echo an markedly dovish stance on Wednesday.
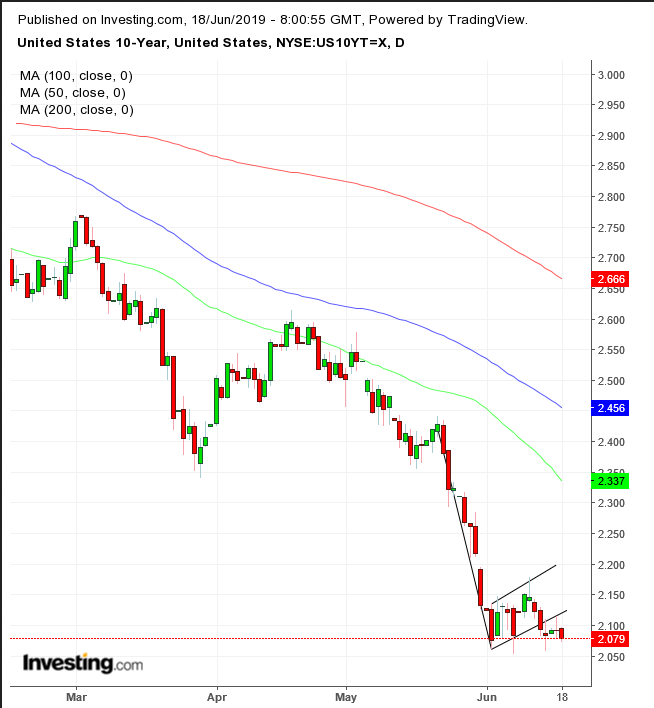
However, investors sought exposure to safe havens too, sending Treasury yields to retest 2017 lows and setting up the USD/JPY pair to complete a bearish pattern.
The STOXX 600 opened lower and initially extended a decline for the third straight day, before investors registered Draghi's words at the ECB annual meeting in Sintra, Portugal. Automobile makers and technology shares underperformed, after the latter led the recent rally globally. From a technical perspective, after slipping below the 100 DMA, the pan-European gauge pared losses, revealing demand.
Conversely, the euro turned lower after climbing. From a technical standpoint, the single currency trades within a downtrend, though it’s extending a breach to the 50 DMA, which puts it one technical step closer to take out the downtrend line and potentially reverse. A potential catalyst for such a breakout is if the Fed validates the forgone conclusion of a rate cut—and adds a softer outlook.

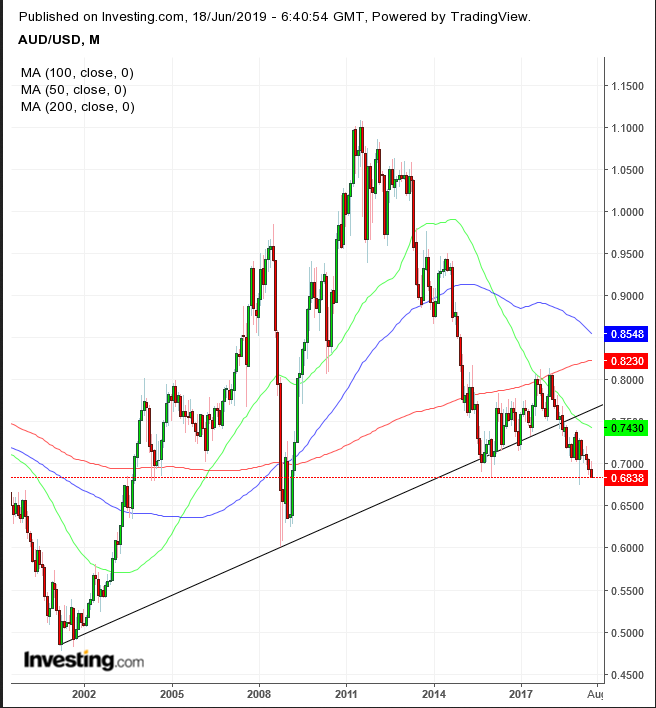
The Aussie also fell, hitting a decade low as investors anticipate further interest rate cuts in the next few months after minutes from the Reserve Bank of Australia's June meeting showed policymakers were keen on considering policy accommodation in the near term.
In the earlier Asian session, stocks were mixed. China’s Shanghai Composite (+0.09%) eked out a slight gain—as the country’s monetary policy loosens—after whipsawing amid low volume ahead of the Fed’s decision. Japan’s Nikkei 225 (-0.72%) dropped to the lowest level in a week-and-a-half on subdued trading, with insurers taking a hit on the outlook for lower rates.
Global Financial Affairs
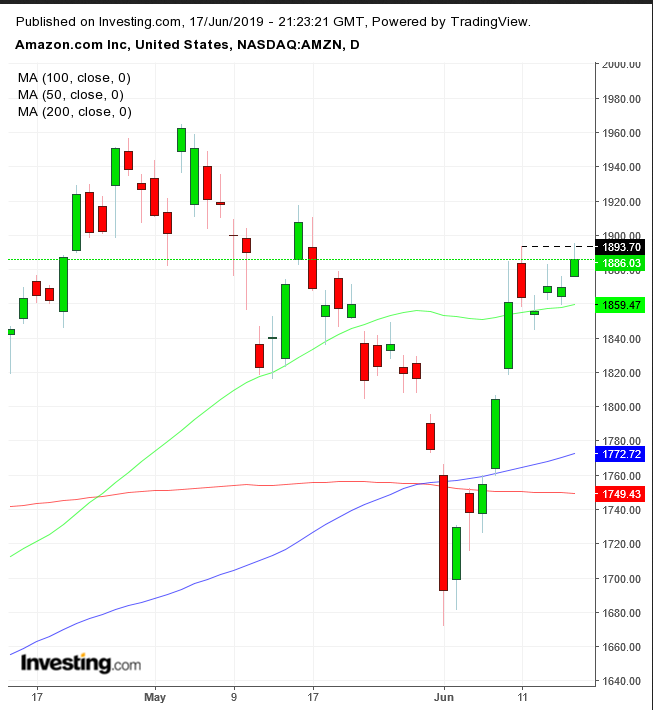
Tech lead an advance in Monday's U.S. trading, with FAANG shares enjoying a climb. Among them, Amazon (NASDAQ:AMZN) had to face some bad press after Representative Alexandra Ocasio-Cortez chastised billionaire CEO Jeff Bezos for paying warehouse workers “starvation wages” while getting subsidies from the government. Business Insider reported in October last year the e-retail giant committed to raise its minimum pay to $15 per hour after mounting criticism by Democratic Representatives.

Technically speaking, the stock of the online heavyweight posted a new high after it bounced off the 500 DMA, extending the uptrend, though it found a resistance of supply by the June 11 high.
Overall, financial markets seem to be counting on the inevitability of an interest rate cut by the Fed, not necessarily via this meeting but by this year. Investors will therefore look for language supporting that view. We don’t expect the Fed to disappoint that expectation, as it would unsettle markets that already priced in a rate cut amid the economic effects of a protracted global trade war, as well as mounting tensions in the Middle East.
However, policymakers will also seek to prove their independence in the face of fresh pressure from U.S. President Donald Trump. Therefore, we expect the Fed to leave a window open for easing but be noncommittal to a cut—walking a tight rope indeed.

Meanwhile, the yield on 10-year Treasurys retested 2017 lows after confirming the resistance of the bearish flag’s bottom yesterday, suggesting yields have yet to hit bottom.

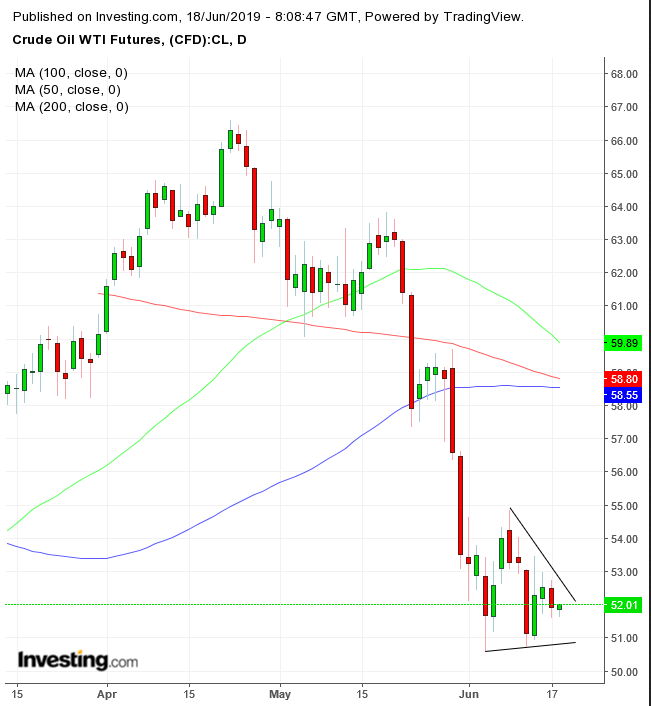
WTI was weighed down by growing OPEC uncertainty, which clouded the outlook for further production cuts. However, with fresh tensions mounting after Trump authorized additional troops to the Gulf of Oman, risk is on the upside.
Technically, a congestion after a drop is biased towards a downside breakout. However, only a downside breakout would complete a pattern presumed to be bearish. An upside breakout would blow it out, unleashing a set up of positions that would catapult prices upward. A congestion among the major moving averages reinforces the price congestion and its expected explosive breakout.
Up Ahead
Market Moves
Stocks
Currencies
Bonds
Commodities
