- Europe drops, U.S. futures waver after Asian session is besieged by low volumes
- U.S. Treasury yields stumble upon resistance, dollar bounces back
- Oil extends Iran-sanction rally but fundamentals tell a different story
Key Events
Equities in Europe and futures on the S&P 500, Dow and NASDAQ 100 slipped this morning, following a mixed performance across Asian indices.

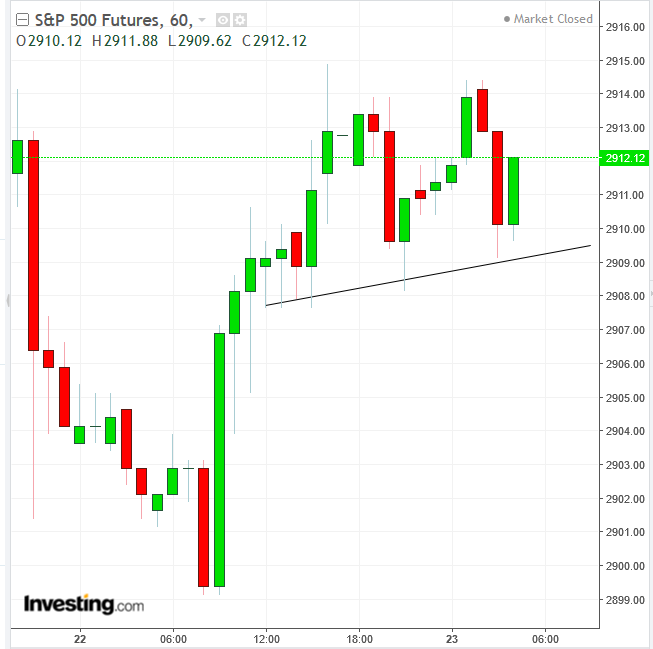
SPX contracts edged lower after rebounding from a slide at the end of the Asian session, thereby increasing the risk of a small double-top to yesterday’s rally.
The STOXX Europe 600 halted a seven-day advance at the open, pulled down by builders, which tracked a U.S. slump in the sector on disappointing industry data. Conversely, energy companies were buoyed by a 2.5% jump in oil prices following the White House's announcement, on Monday, that it will withdraw waivers on Iranian sanctions. The news helped contain the overall slump of the pan-European benchmark—in line with its effect on U.S. indices yesterday.
In earlier Asian trading, volumes stood below 30-day averages ahead of Japan’s extended Golden Week holiday. Shares climbed on Tokyo’s Nikkei 225 (+0.19%) and slipped on Hong Kong’s Hang Seng (-0.14%) and China's Shanghai Composite (-0.51%). Australia’s S&P/ASX 200 outperformed its regional peers, climbing 0.95%
Global Financial Affairs
On Monday, U.S. stocks managed to seal a gain despite light volumes, with prices reaching the highest close since Oct. 3 ahead of an onslaught of corporate earnings reports.
The S&P 500 eked out a 0.1% gain, with sector performance widely split. Energy shares (+2.11%), which tracked surging oil prices, almost singlehandedly pushed the index into green territory, as the second-best performer, Communication Services, followed quite far behind (+0.45%). Real Estate stocks tumbled (-1.10%) after existing home sales data disappointed expectations, falling to -4.9% in March, against the -3.8% slide analysts had forecast. Technically, the SPX closed 0.77% from the Sept. 20 record.
The Dow Jones Industrial Average slid 0.18%, erasing half of Thursday’s jump, which had pushed the index 1.01% away from its Oct. 2 record close.
The NASDAQ Composite outperformed, advancing 0.22% to within 1.15% from its Sept. 29 record close.
The Russell 2000 dropped 0.49%, faring as the session's hardest faller. Technically, the small-cap stock benchmark fell to the lowest level since Apr. 9, increasing the potential for a double-top reversal.

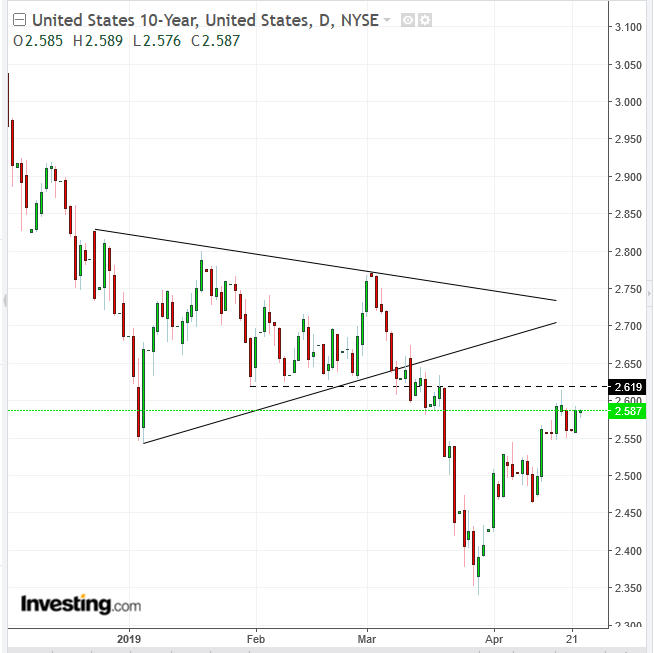
Meanwhile, the yield on 10-year Treasurys struggled to maintain its monthly high levels, after last Wednesday’s shooting star confirmed the resistance of the bottom of the Jan. 31- Mar. 11 trading range.

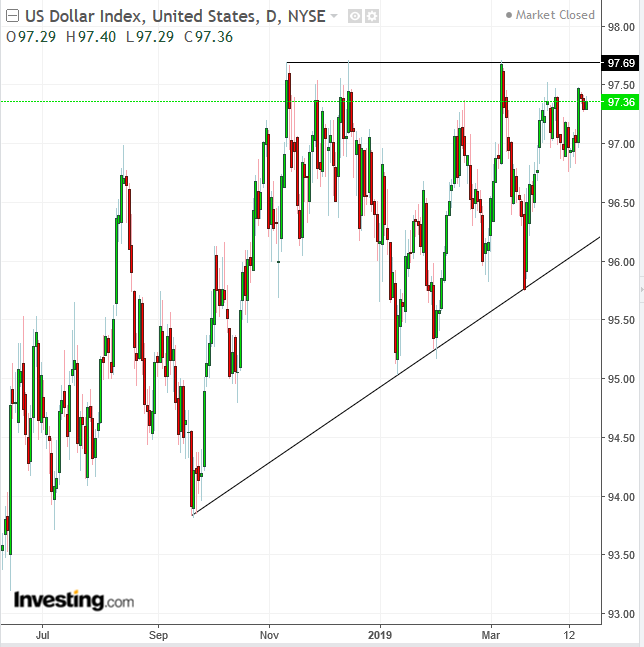
The dollar bounced back from a two-day selloff, toward the top of an ascending channel.
On the other side of the Atlantic, European sovereign bonds ticked lower with the euro.
Overall, earnings results from the world’s biggest technology companies (see details below) will likely monopolize investor attention this week, along with first-quarter U.S. GDP figures out on Friday. However, global central banks' monetary policy will continue to be the biggest catalysts for stocks, after their recent dovish tilt boosted global equity prices.
In commodities trading, yesterday’s oil price leap completed a pennant continuation pattern, with a conservative inherent target—based on measuring the previous sharp move—of about $67. This may be preceded by a return move, to retest the pattern’s integrity and, with it, the uptrend.
From a fundamentals perspective, China remained defiant against U.S. sanctions on Iranian oil and Goldman Sachs analysts don't see prices rallying despite the reimposition of the ban.
Up Ahead
- The Bank of Japan, Bank of Canada, Bank of Russia, Sweden’s Riksbank and Bank of Indonesia all set monetary policy this week.
- Germany’s IFO data is released on Wednesday.
- Japan’s Prime Minister Shinzo Abe meets leaders from the European Union on Thursday before flying to the U.S. for a summit with President Donald Trump.
- The initial print of first-quarter U.S. GDP will be closely watched on Friday for clues as to how the economy responded to the government shutdown and to the fourth-quarter market rout.
Earnings
- Twitter (NYSE:TWTR) is scheduled to post earnings before market open on Tuesday, with expectations of $0.06 EPS, from $0.09 in the same quarter last year. The social media company may soon start to reap the benefits of its recent efforts to step up both transparency and user experience standards.
- Snap (NYSE:SNAP) reports earnings after market close today, with EPS forecasts at $-0.22 and revenues at $305.5m. The online platform operator has set itself a high bar by posting rosy expectations on user engagement and other key metrics.
- Microsoft (NASDAQ:MSFT) reports results after market close on Wednesday, with an EPS of $1, from the $0.95 it posted last year.
- Facebook (NASDAQ:FB) is expected to release earnings after market close on Wednesday, with a $1.65 EPS, slightly lower than the $1.69 it posted last year.
- Amazon (NASDAQ:AMZN) is due to report earnings after market close on Thursday, with a $4.61 EPS forecast, from $3.27 last year.
- European bank earnings kick into full gear with reports from Deutsche Bank (DE:DBKGn), UBS(NYSE:UBS), Barclays (LON:BARC), Credit Suisse (SIX:CSGN) and Swedbank (ST:SWEDa).
Market Moves
Stocks
- The MSCI Asia Pacific Index gained 0.1%.
- The MSCI Emerging Market Index slipped 0.1% to the lowest in more than a week.
Currencies
- The Dollar Index gained 0.1%, hitting the highest in more than three weeks with the first advance in almost four weeks.
- The euro fell 0.1% to $1.1246.
- The Japanese yen climbed 0.1% to 111.88 per dollar, the strongest in more than a week.
- The British pound advanced less than 0.05%.
- The MSCI Emerging Markets Currency Index fell less than 0.05%.
Bonds
- The yield on 10-year Treasurys slid one basis point to 2.58%.
- Germany’s 10-year yield increased one basis point to 0.04%.
- Britain’s 10-year yield gained one basis point to 1.212%.
- The spread of Italy’s 10-year bonds over Germany’s advanced two basis points to 2.593%age points to the widest in almost eight weeks.
Commodities
- The Bloomberg Commodity Index climbed less than 0.05% to the highest in more than a week.
- Brent crude gained 0.6% to $74.46 a barrel, the highest in almost six months.
- LME copper fell 0.8% to $6,426.50 per metric ton, the lowest in more than a week.
- Gold dropped 0.2% to $1,272.95 an ounce, the weakest in almost four months.
