- Global stocks fall; gold, yen, Treasurys climb on U.S.-North Korea summit flop
- China manufacturing PMI re-ignites fears of global slowdown; U.S. top negotiator casts shadow over trade deal
- Oil halts gains
Key Events
Shares in Europe dropped alongside futures on the S&P 500, Dow and NASDAQ 100 this morning, tracking an Asian selloff, after the much anticipated U.S.-North Korea summit ended earlier than expected, with no signed agreement. Safe havens including gold, the yen and Treasurys strengthened on risk-off demand.
Suddenly, geopolitics were back in the mix: an abrupt, premature end to the Trump-Kim summit; mounting worries around the India-Pakistan standoff; Brexit posing ongoing yet unquantifiable risks to the wider financial system.
Adding to that, weak Chinese manufacturing data returned the global slowdown to the forefront of market's attention, pushing the STOXX Europe 600 lower with miners shares.
Seemingly deliberately vague monetary policy signals from the Fed and dashed hopes on a quick U.S.-China resolution completed a picture that warranted caution.
In the earlier Asian session, the regional market, which may have been pricing the increased confidence that would come with tangible progress towards stability in the region—and one less geopolitical risk to worry about—quickly rebalanced as traders rushed to take advantage of the new price inefficiency.
South Korea’s KOSPI (-1.76%) was the obvious laggard—as the most directly affected by the northern neighbor's political isolation—losing more than double the runner up, Japan’s Nikkei 225 (-0.79%). The won dropped 0.6%.
Global Financial Affairs
On Wednesday, most U.S. stocks ended a volatile session lower for a second day, on concerns that U.S. President Donald Trump would settle for a bad trade deal with China, as Trade Representative Robert Lighthizer warned Congress that only an all-encompassing agreement, requiring structural changes in China, would be acceptable for the country. At the same Congressional hearing, Trump's former lawyer Michael Cohen added to pressure on the president, heightening the focus on his political debacles—including alleged wrongdoings during his 2016 campaign and hush payments.
The S&P 500 slipped 0.05% into the red, with Communication Services (-0.5%) and Healthcare (-0.47%) driving most of the losses, while Industrials (+0.39%), Energy (+0.38%) and Financials (+0.38%) held the line from an even deeper setback.
The Dow Jones Industrial Average dropped 0.28%. The NASDAQ Composite (+0.07%) managed to claw onto positive territory, as did the Russell 2000 (0.16%).

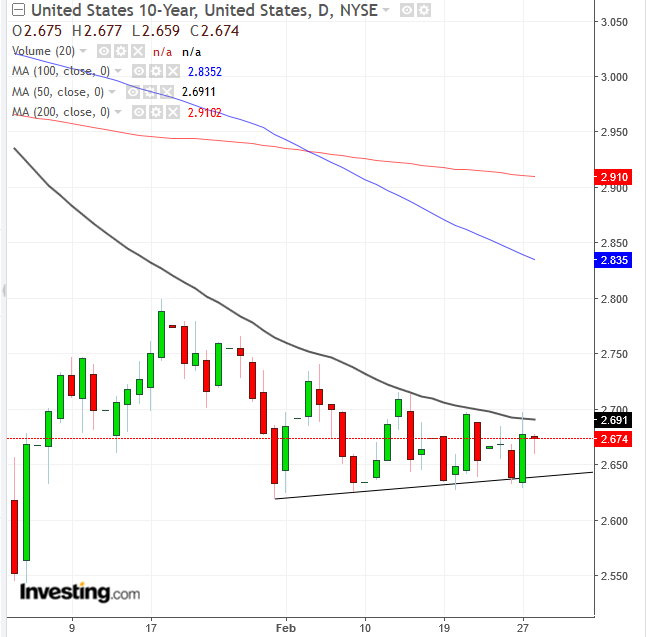
After climbing on risk-off yesterday, yields on 10-year Treasurys subsided. Technically, rates fluctuate within a triangular consolidation, as we use the 50 DMA as the natural upper border.

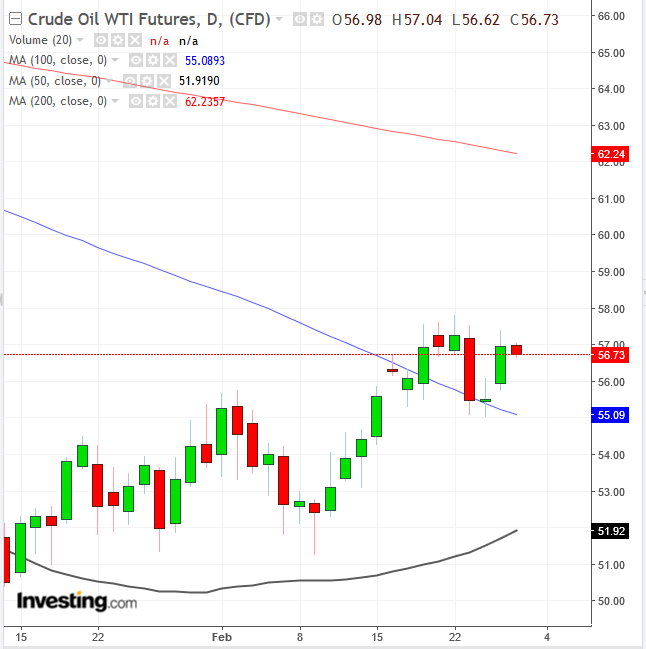
Meanwhile, oil prices retreated for the first time in three days due to falling U.S. imports. Technically, the market is catching its breath after scaling above the 100 DMA. The upward curving 50 DMA (black) suggests traders will give the rally another go.

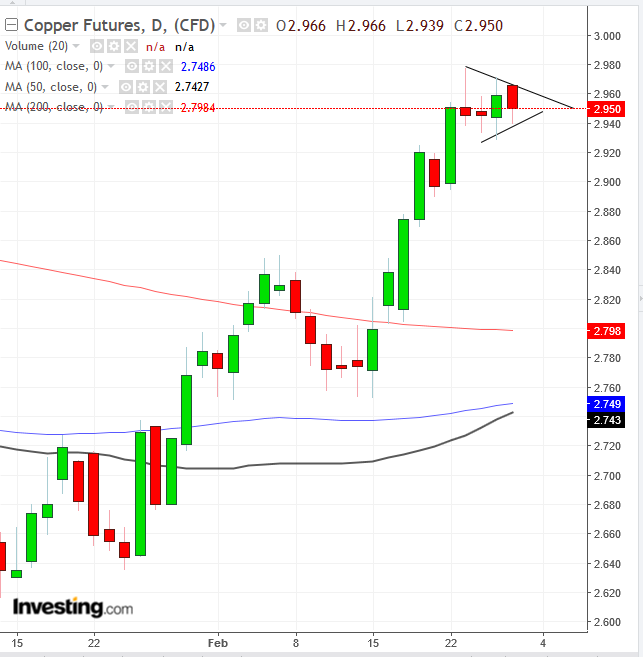
Copper also dropped, paring half of yesterday’s gains, which had marked the first advance after a two-day decline. Technically, the price is consolidating in what is probably a pennant, a continuation pattern, and therefore bullish within its uptrend.
Up Ahead
- Fourth-quarter U.S. GDP figures come out on Thursday.
- U.S. personal income and spending data is released Friday.
Market Moves
Stocks
- The STOXX 600 slipped 0.5 percent, the lowest in a week on the largest decrease in almost three weeks.
- Futures on the S&P 500 fell 0.4 percent to the lowest in a week on the biggest fall in a week.
- The MSCI Asia Pacific Index slid 0.6 percent to the lowest in a week on the largest decrease in almost two weeks.
- The MSCI Emerging Market Index fell 0.6 percent to the lowest in a week on the biggest decrease in almost two weeks.
Currencies
- The Dollar Index declined 0.1 percent.
- The euro edged 0.1 percent higher to $1.1382.
- The Japanese yen gained 0.3 percent to 110.72 per dollar.
- The MSCI Emerging Markets Currency Index slid 0.1 percent to 1,649.37.
- South Africa’s rand fell 0.1 percent to 13.9507 per dollar.
Bonds
- The yield on 10-year Treasurys dropped two basis points to 2.66 percent.
- Germany’s 10-year yield slid one basis point to 0.14 percent.
- Britain’s 10-year yield lost two basis points to 1.258 percent.
- The spread of Italy’s 10-year bonds over Germany’s declined two basis points to 2.6166 percentage points.
Commodities
- The Bloomberg Commodity Index decreased 0.1 percent.
- Brent crude fell 0.7 percent to $65.95 a barrel.
- LME copper declined 0.3 percent to $6,485.00 per metric ton, the first retreat in a week.
- Gold increased 0.2 percent to $1,322.56 an ounce.
