- STOXX Europe, US futures rebound after dropping on chipmakers risk, Metro Bank flop
- Dollar gains ground
- Oil hit by Venezuela woes
- U.S. stocks edge higher after swings amid thin trading
Key Events
European stocks and futures on the S&P 500, Dow and NASDAQ 100 rebounded from a weak start this morning, following a batch of poor corporate updates that had further tested investor nerves amid ongoing global-growth and trade-war jitters.
The STOXX Europe 600 climbed into positive territory after a volatile opening trading hour, mostly weighed down by Metro Bank's (LON:MTRO) profit miss. The UK lender's stock plunged 38 percent to an all-time low yesterday after the group revealed a spike in exposure to risky mortgages and posted soft guidance, sparking fears of a shareholder cash call.
Initially, the index was also pushed lower by chipmakers such as ASML Holding (AS:ASML), which had dropped on reduced guidance.
Carmakers also performed poorly at the open, at the mercy of uncertain U.S.-Sino trade talks. A weak German auto sector is one of the primary drivers of the current European slowdown.
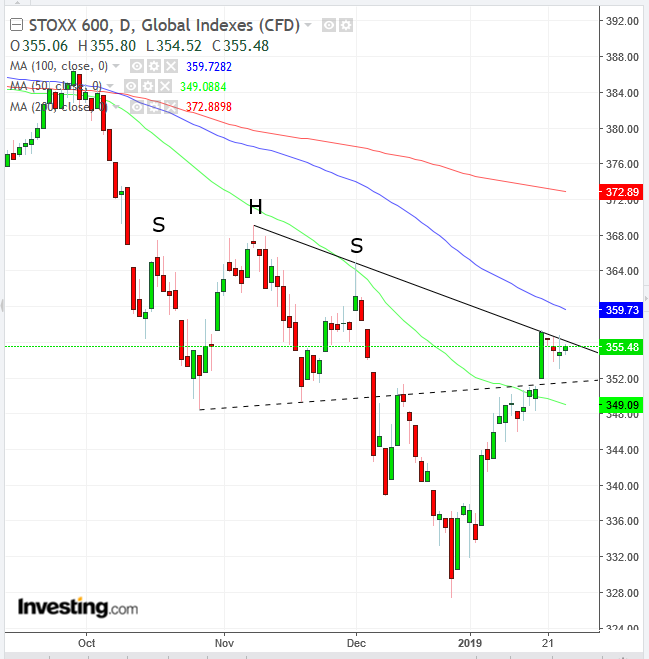
Today's rebound might mean that traders are hopeful on the technicals, after the 8 percent comeback from the pre-Christmas rout, which pushed shares to a two-year low. But are valuations still cheap enough to offset the flurry of economic, geopolitical and sentiment-based headwinds?

The price of the pan-European benchmark found resistance precisely beneath a downtrend line since November 8, after rebounding from achieving a H&S continuation’s implied target. The onus is on the bulls to demonstrate their willingness to overcome the bears line-in-the sand (downtrend line). However, should they manage to do so, they are likely to convert some bears, catapulting prices toward the 400 mark, where the 100 DMA awaits.
In the earlier Asian session, equities crawled higher on thin volumes, in line with the U.S. market pattern, as investors sit on the fence amid persistent political risk and signs of a slowdown. South Korea’s KOSPI gained 0.81 percent, outperforming its regional peers thanks to the biggest foreign capital inflows since September, which helped chipmakers' stocks buck the U.S. and European downtrend.
Foreign investors chose to focus on depressed share price versus valuations, showing a bullish interest in the chipmaker sector even after fourth-quarter profits from SK Hynix (KS:000660), the world’s second-biggest memory chipmaker, disappointed. Demand came in purely on the technicals, after analysts believed prices had bottomed. Also, a weak Korean won added to the attractiveness of local stock prices.
Global Financial Affairs
In the U.S. session, share managed to close higher after swinging between gains and losses through the whole session, as investors were trying to gauge the likelihood of an economic slowdown.

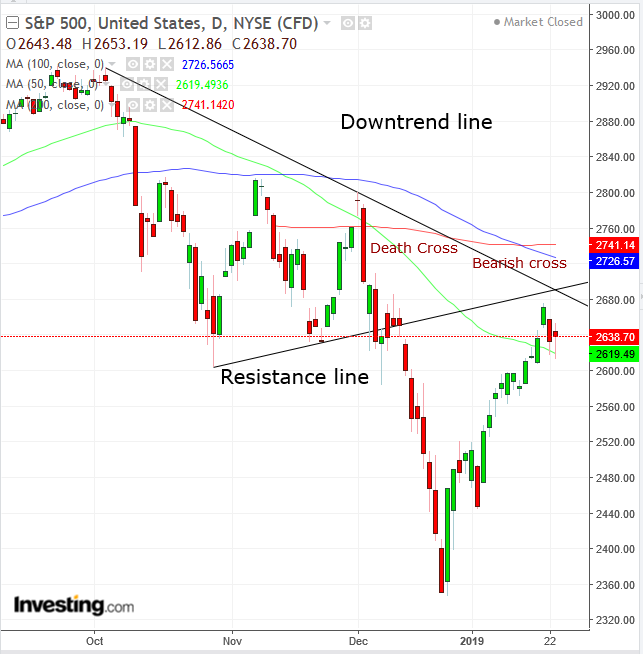
The S&P 500 gained 0.22 percent. Technically, bulls and bears struggle under the 2,700 levels, a technical red zone. Eight of the index's 11 sectors closed in green territory. However, traders should take note that defensive sectors were responsible for those gains, with Consumer Staples adding 1.19 percent and Utilities climbing 1.01 percent.
While Industrials (+0.15 percent) escaped its anti-trade-resolution proxy status, the same can't be said for Materials (-0.68 percent), which remained under pressure from trade-related risk after the International Monetary Fund cut its global economic outlook citing the impact of the U.S-China trade war. And Energy (-1.02 percent) led the day's laggards, tracking a second-day decline for oil.
The Dow Jones Industrial Average added 171.14 points, or 0.7 percent, with listed companies beating earnings expectations. IBM (NYSE:IBM) leaped 8.46 percent after posting adjusted fourth quarter results above analyst expectations. This confirmed what is emerging as this quarter’s trend, with names like General Motors (NYSE:GM) and major U.S. banks revising guidance upward. Last quarter, companies’ lower outlook represented one of the strongest market headwinds. Procter & Gamble (NYSE:PG) provides a case in point: despite posting modestly stronger-than-expected second-quarter earnings, its stock climbed 4.87 percent as the firm raised its full-year sales guidance.
The NASDAQ Composite (+0.08 percent) averted a second-day loss but failed to gain much traction, as tech stocks feel the heat of unresolved U.S.-Sino trade dispute over copyright protection.
The Russell 2000 was the only major U.S. index closing lower (0.27 percent).
Investors are once again caught in between solid earnings and rising corporate outlooks—which benefit from a slower path to interest rates tightening in the U.S., compounded by aggressive economic stimulus in China—and mounting political and geopolitical headwinds. Overall, doubts over foreign trade and politics continue to permeate global markets. The chair of the White House's Council of Economic Advisers, Kevin Hassett, said yesterday that if the partial government shutdown extends through March, there’s a chance economic expansion will be null this quarter, though “humongous” growth would follow once federal agencies reopen.
And U.S. President Donald Trump's top economic adviser Lawrence Kudlow said on Tuesday that negotiations between the U.S. and China next week will be “determinative,” leaving traders on the edge about the possibility that a final deal will be sealed. Meanwhile, it’s not clear whether any measures to reopen the government will pass the Senate's vote on Thursday, adding to political uncertainty.
Since the Brexit vote, and with the rise of populism around the world, investors repeatedly demonstrated that they are willing to ignore geopolitical risk, as long as economic and corporate data come in strong.
The million-dollar question is, therefore: how weak is global—and particularly Chinese—growth? The follow-up question should be: however strong the U.S. economy is, how long will it be able to continue to grow in a vacuum, especially this late in the business cycle, and during the longest bull market on record? As we’ve been saying since the strong post-Christmas rally, we’d place our bets on the market falling going forward, with the 2,700 levels—maybe the 2,800 levels—representing the downturn’s stress test. From a risk-reward ratio standpoint, U.S. stocks are standing in an ideal entry point for a short position.

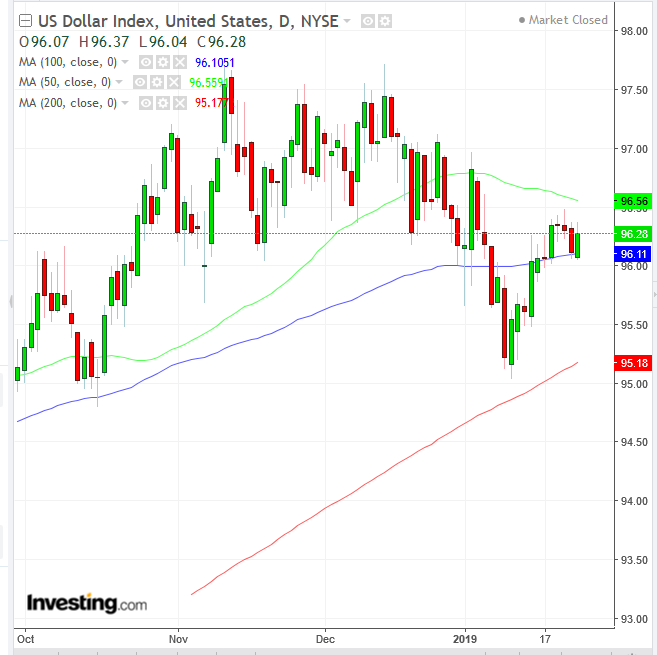
In other news, the dollar wiped out yesterday’s losses, finding support above the 100 DMA, but still below the tight range since October.
WTI initially seemed to have found demand, consolidating for the third day, amid mounting civil unrest in Venezuela. The U.S. has threatened to impose sanctions on crude exports from the OPEC oil-producer as opposition to President Nicolás Maduro gains yet more traction. However, U.S. crude started edging lower by the late European morning session.
Up Ahead
- The World Economic Forum, the annual gathering of global leaders in politics, business and culture, continues in Davos, Switzerland.
- The European Central Bank decides on monetary policy on Thursday.
Market Moves
Stocks
- The MSCI All-Country World Index increased less than 0.05 percent.
- The MSCI Emerging Market Index rose 0.4 percent.
Currencies
- The Dollar Index gained 0.2 percent.
- The euro fell 0.2 percent to $1.1355, the weakest in more than three weeks on the biggest fall in more than a week.
- The Japanese yen slipped 0.1 percent to 109.68 per dollar.
- The British pound declined 0.2 percent to $1.3043.
- The MSCI Emerging Markets Currency Index climbed less than 0.05 percent.
Bonds
- The yield on 10-year Treasurys slid one basis point to 2.73 percent, the lowest in more than a week.
- Germany’s 10-year yield slipped one basis point to 0.21 percent, the lowest in more than a week.
- Britain’s 10-year yield declined two basis points to 1.311 percent, the lowest in more than a week.
- The spread of Italy’s 10-year bonds over Germany’s fell two basis points to 2.5085 percentage points.
Commodities
- The Bloomberg Commodity Index edged less than 0.05 percent lower to the lowest in more than a week.
- West Texas Intermediate crude declined 0.4 percent to $52.43 a barrel, the lowest in a week.
- LME copper fell 0.4 percent to $5,929.50 per metric ton, the lowest in more than a week.
- Gold dropped 0.2 percent to $1,280.07 an ounce, the weakest in four weeks.
